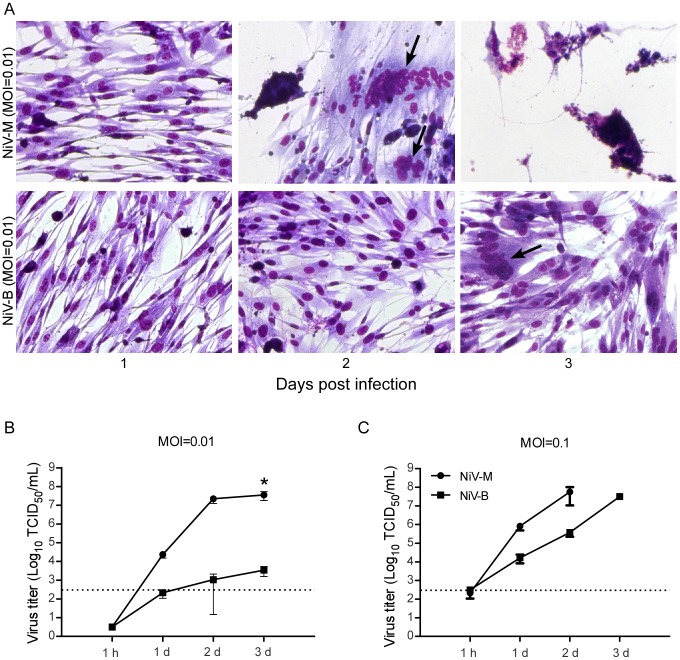
Figure 1. NiV-M replicates more efficiently and causes increased cytopathogenicity in hamster cells compared to NiV-B.
To study the cytopathogenicity of these Nipah viruses, BHK-21 cells were infected with NiV-M or NiV-B at an MOI of 0.01 and stained using the Kwik Diff Kit at 1, 2, and 3 dpi (A). Arrows point to multinucleated giant cells. To examine the viral growth kinetics, BHK-21 cells were infected with Nipah virus at an MOI of 0.01 (B) or 0.1 (C). and supernatants were collected at the indicated time points. Supernatants of NiV-M at an MOI of 0.1 at 3 dpi were not collected due to extensive destruction of the cell monolayer. Virus was titrated on Vero C1008 cells and the results are expressed as the mean of three replicates and error bars indicate the SEM. The dotted line denotes limit of detection for the assay. A 2-way ANOVA with Bonferroni's post test was used to compare the viruses (* = p<0.05).

