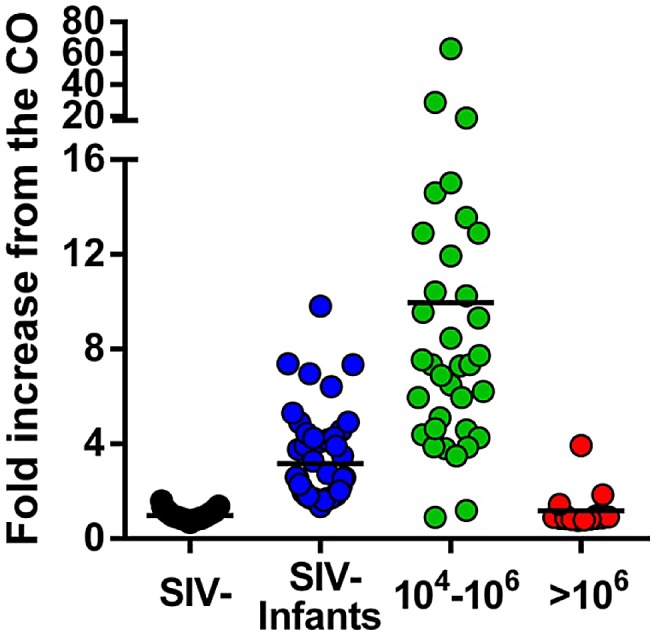
Figure 6. anti-SIVagmVer IgG antibody seroprevalence in vervets from South Africa.

Testing was done by peptide ELISA (mapping the immunodominant region of gp41 of SIVagmVer). Samples were grouped based on PCR and VL quantification results as originating from uninfected vervets, SIV-infected vervets with VLs>106 SIVagmVer RNA copies/ml, SIV-infected vervets with VLs ranging from 104 to 106 SIVagmVer RNA copies/ml and samples from infant vervets. Samples in the latter group are negative by PCR but show different levels of anti-SIVagm IgG, therefore being suggestive of transplacental crossing of maternal antibodies. Values on the Y-axis represent fold increases of the optical density of the samples (measured at 492 nm) over the cut-off value (established at an optical density of 0.2).
