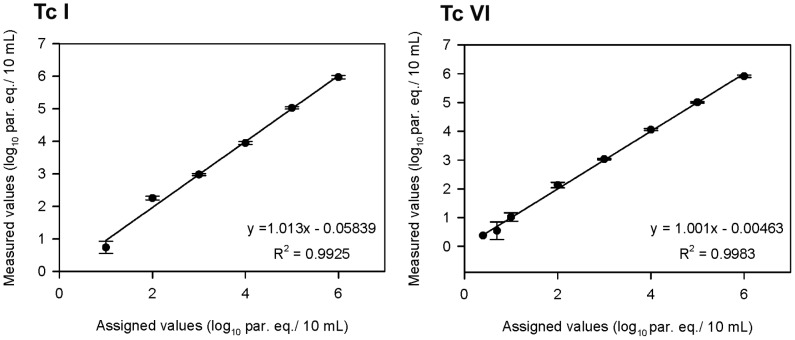
Figure 1. Anticipated reportable range and linearity of qPCR method.
Multiplex TaqMan qPCR strategy was carried out with spiked GEB samples containing parasite stocks belonging to TcI and TcVI in ten concentrations spanning 106 to 0.625 par. eq./10 mL, tested in triplicate. Assigned values were plotted on the x axis versus measured values (converted to log10) on the y axis using SigmaPlot 10.0 for Windows (SPSS, Chicago, IL). Linear regression analysis rendered the equation y = 1.013x+0.058 (R2 = 0.992) for TcI, and y = 1.001x+0.005 (R2 = 0.998) for TcVI.

