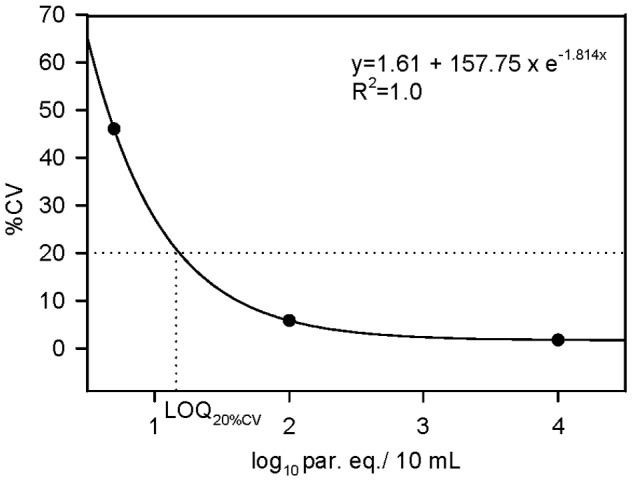
Figure 2. Estimation of the Limit of quantification of qPCR method.

The LOQ was derived from a 20% threshold value for the coefficient of variation (CV) of measurements obtained in the precision experiments reported in Table 4. Linear least squares curve fit for relationship between CV and parasite concentration (log10 par. eq./10 mL) using SigmaPlot 10.0 for Windows (SPSS, Chicago, IL). The derivation of LOQ20%CV is illustrated by dotted lines.
