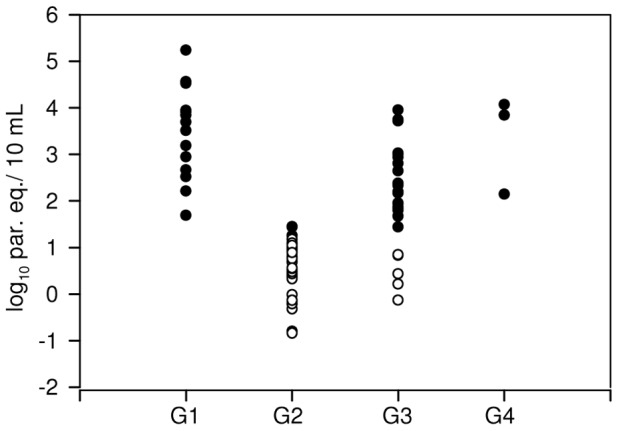
Figure 3. Distribution of parasitic loads in different patients' groups.

Detectable qPCR findings obtained from peripheral blood samples of Chagas disease patients: G1, orally-acquired infected patients from Chacao, Venezuela (n = 14); G2, chronic Chagas disease patients from Cochabamba, Bolivia (n = 38); G3, chronic Chagas disease patients from endemic regions of Argentina (n = 26); G4, congenitally infected newborns to seropositive women (n = 3). LOQ: Limit of quantification. •: Quantifiable samples above LOQ, ○: Detectable samples below LOQ (1.185 log10 par. eq./10 mL).
