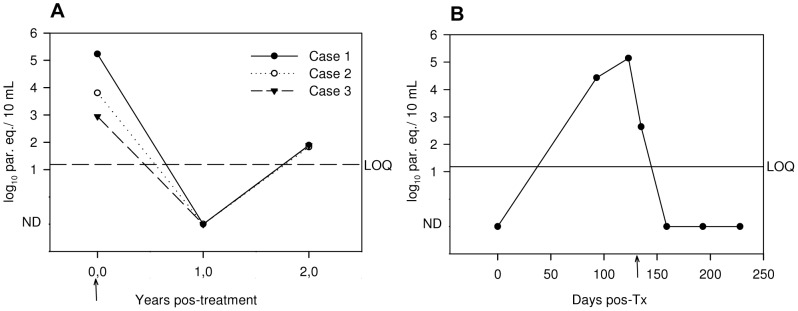
Figure 4. Follow-up of T. cruzi infected patients using qPCR.

A. Follow-up of orally infected cases from Chacao, Caracas, Venezuela. Years pos-treatment (ys pos-T) are represented in the x-axis. Parasite equivalents (par. eq.) were estimated using a Silvio X-10 (TcI) calibration curve. Case 1- Pre-T: 5.23 log10 par. eq./10 mL; 2 ys pos-T: 1.88 log10 par. eq./10 mL. Case 2- Pre-T: 3.78 log10 par. eq./10 mL; 2 ys pos-T: 1.83 log10 par. eq./10 mL. Case 3- Pre-T: 2.94 log10 par. eq./10 mL; 2 ys pos-T: 1.88 log10 par. eq./10 mL. B. A 42 year-old seronegative man received kidney transplantation from a seropositive cadaveric donor. Progression of parasitic load after transplantation is shown as well as post-treatment follow-up. The quantification was estimated using a Cl-Brener (TcVI) calibration curve. Days pos-Transplantation (Tx) are represented in the x-axis. The number of par. eq./10 mL of blood is represented in the y-axis, in a log-scale. Arrow marks initiation of Benznidazole treatment. ND: not detectable. The line indicates LOQ (1.185 log10 par. eq./10 mL) derived from analysis of CL-Brener (TcVI) spiked samples. Discontinued line: parasitic loads in Chacao patients were estimated with Silvio X-10 (TcI) calibration curves.
