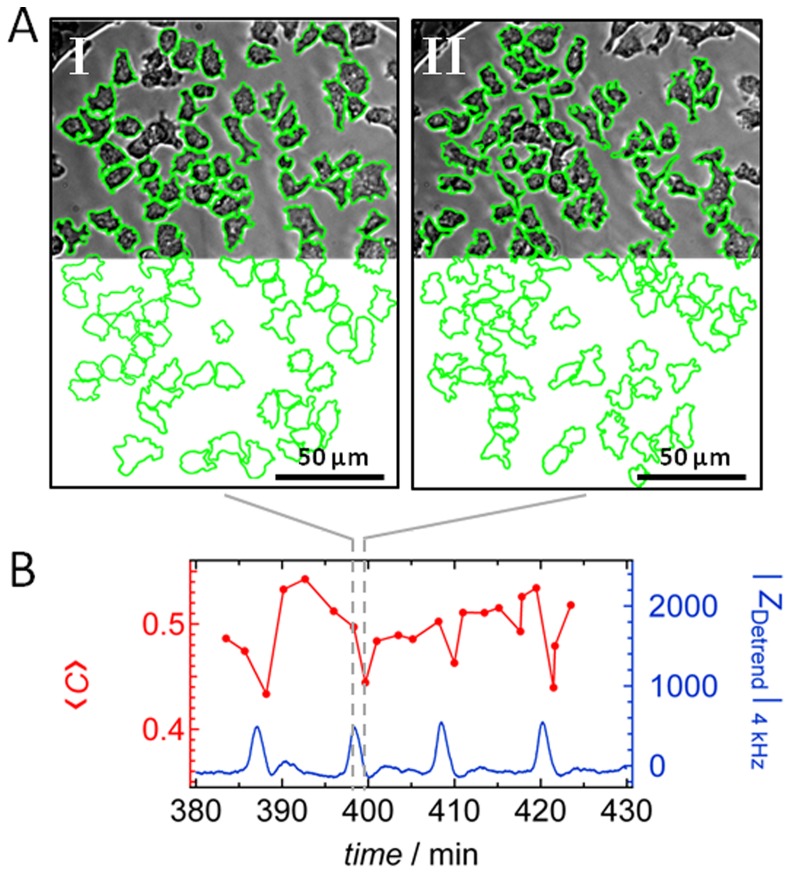
Figure 4. Changes in circularity of D. discoideum.
A) Optical micrographs of the ameba-covered electrode taken at two different times as marked by the dashed line in (B). Cells’ perimeters were manually surrounded by a green line to compute circularity. For sake of clarity, the electrode is eradicated from the bottom part of the images. B) Circularity <C> of D. discoideum cells determined as a function of time (red dots). Additionally, the corresponding time series of the detrended impedance values |Z Detrend|4 kHz from the same area is shown in blue.

