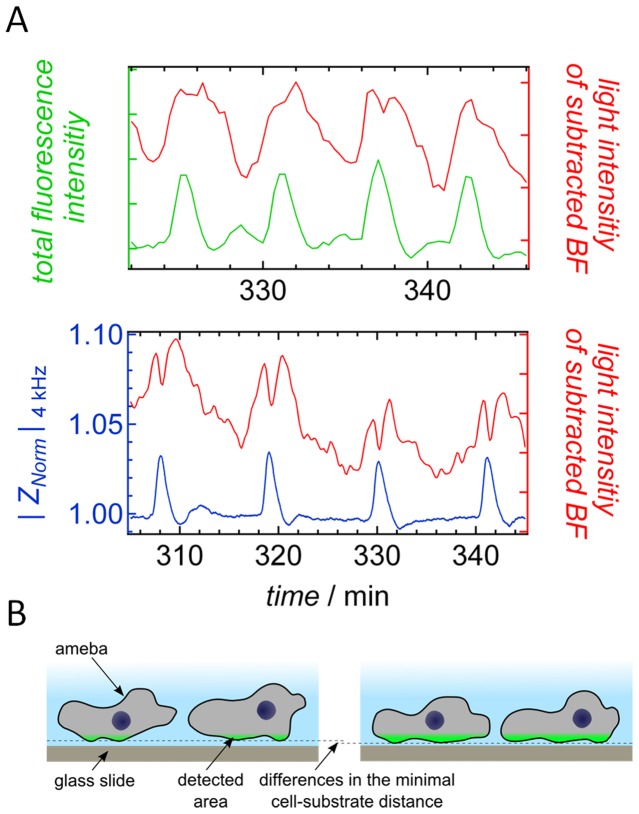
Figure 6. Correlation between TIRF and ECIS experiment.
A) Oscillating gray tone of subtracted bright field images (red) in comparison to the total fluorescence intensity of the corresponding TIRF images (green) and the impedance signal (black) as a function of time. The procedure allows to correlate the two independent experiments. B) Scheme of the two proposed states that amebas assume during TIRF microscopy explaining low fluorescence intensity (left) and high intensity (right). The minimal cell-substrate distance is not significantly undercut, only the overall contact zone increases leading to larger fluorescence intensity and impedance.

