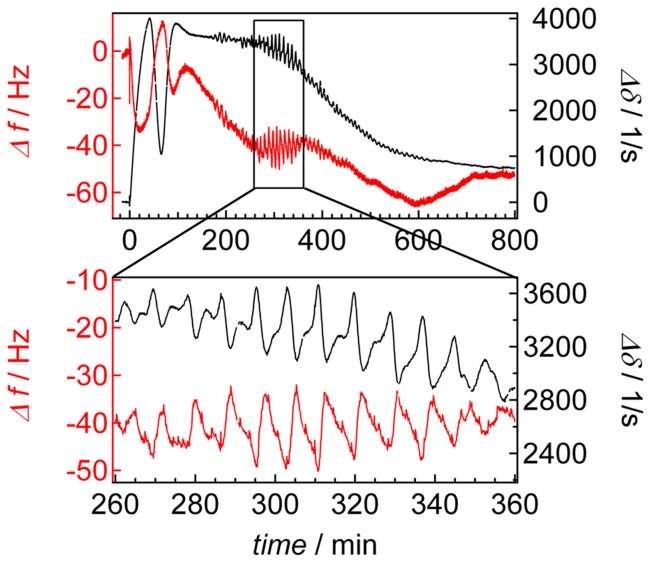
Figure 7. D-QCM of D. discoideum chemotaxis.
D-QCM measurement of starved D. discoideum amebas. Shift in resonance frequency (red) and damping (black) of an oscillating quartz crystal as a function of time. D. discoideum cells (10,000 cells mm−2) were seeded at t = 0 on a gold-electrode. The black box highlights the time period during which collective oscillations occur.

