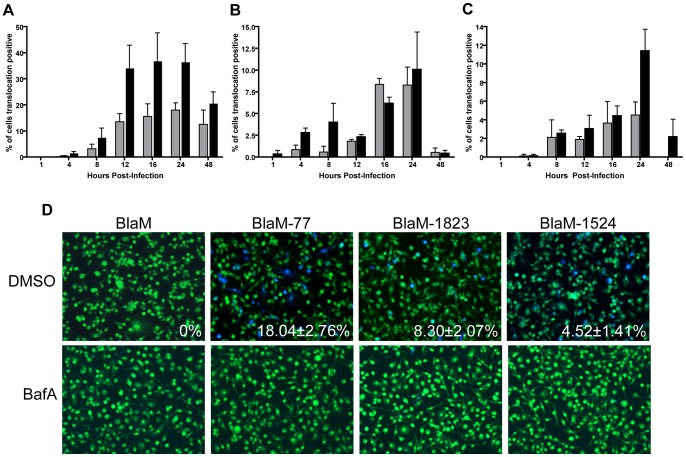
Figure 4. Effector translocation in restrictive bone marrow macrophages.
Stationary phase C. burnetii NM expressing BlaM-77 (A), BlaM-1823 (B) or BlaM-1524 (C) were used to infect BMMs derived from C57BL/6 mice at an MOI of 100 (grey bars) and 500 (black bars). CCF4-AM was added at the time points shown and low magnification images were analyzed to calculate the percentage of cells that were translocation positive. At least 300 cells were quantified per well and each infection was performed in triplicate wells. These experiments were performed at least three independent times. Representative fluorescent micrographs of MOI 100 infections at 24 hours post-infection demonstrate translocation of BlaM-77, BlaM-1823 and BlaM-1524 (D). The mean ± standard deviation percentage of cells that were translocation positive (blue) is displayed in the bottom right corner of each micrograph. Additionally, the inclusion of 100 nM BafA at the time of infection led to no detectable translocation for any of the reporters (D). No translocation was detected for C. burnetii expressing BlaM alone or for C. burnetii NM icmL::Tn expressing any of the reporter constructs.

