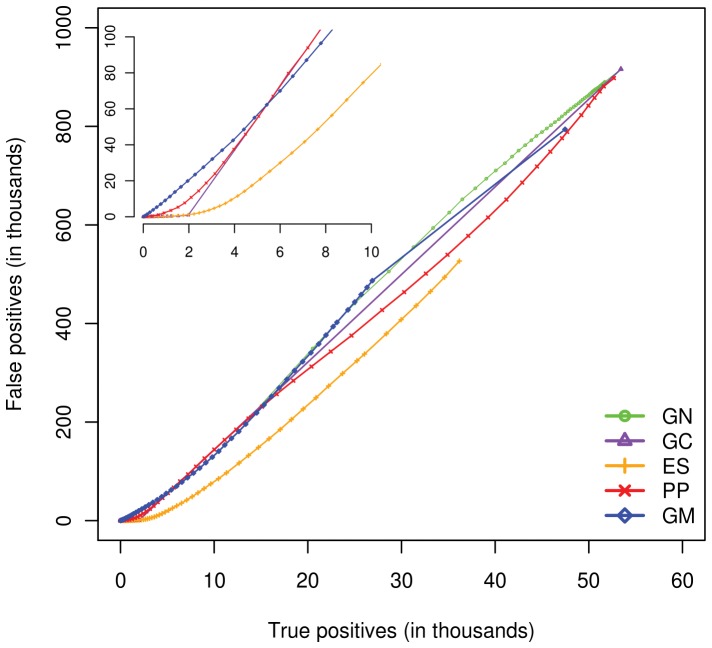
Figure 2. Predictive power of physical and functional protein-protein interaction prediction methods.
Each point on this plot represents specific interaction score threshold of prediction methods at which the true and false positives were counted. Inset on the plot shows reduction of false positives at higher interaction score cutoffs for GC, PP, ES and GM prediction methods. The performance of all methods is near diagonal. Even at highest score cutoff GN predicted more than 13,868 TP and 210,963 FP hence its line is not visible in the inset. Expression Similarity (ES) is the best performing method. Phylogenetic Profiling, Gene Neighbor, Gene Cluster and Genome Distance-Mirrortree are abbreviated as PP, GN, GC and GM respectively.

