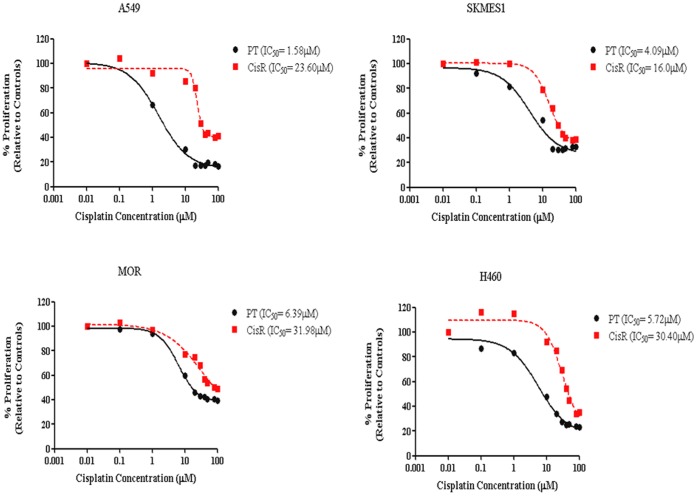
Figure 2. Cells exhibit increased fold changes in IC50 concentrations following long-term exposure to cisplatin.
Following maintenance of cisplatin treated sublines in culture for 6 months with cisplatin, IC50 concentrations were re-assessed for each cell line using dose-response curves generated by GraphPad Prism software. A significant increase in IC50 concentration was determined for each cisplatin resistant cell line relative to that for the corresponding age-matched parental cell line.

