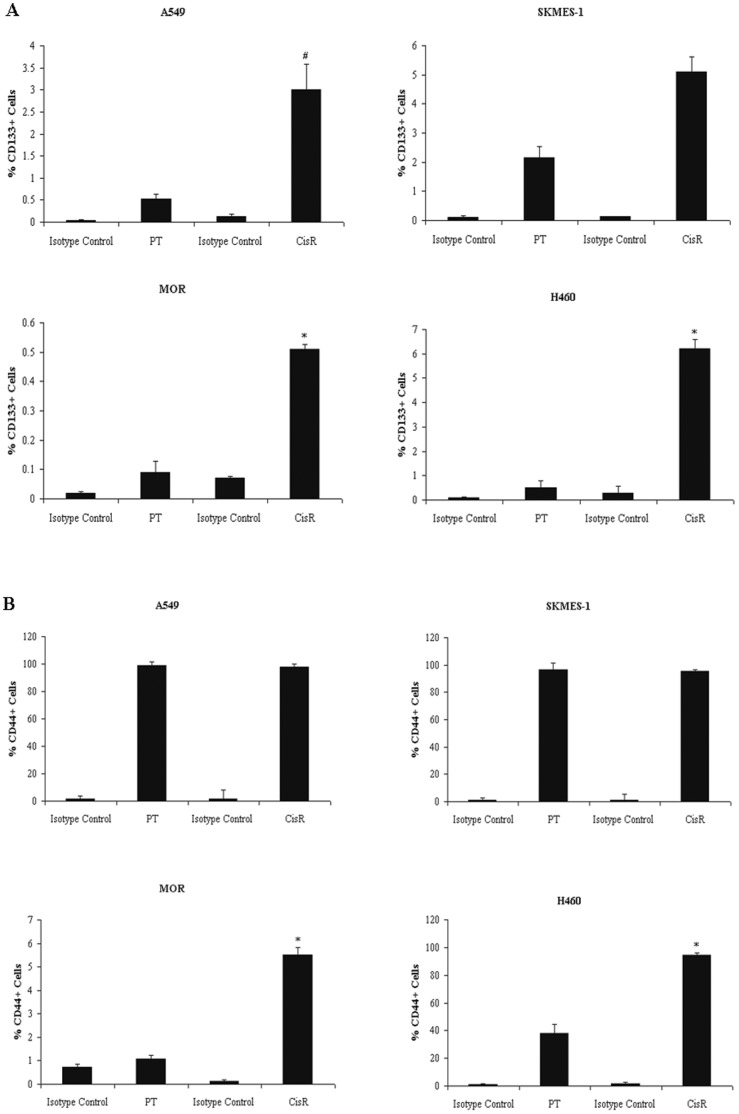
Figure 7. Enrichment of CD133+ and CD44+ fractions in cisplatin resistant sublines.
Antibody staining of PT and CisR cell lines for CD133 cell surface expression was carried out by flow cytometry using a CD133/1 (AC133) phycoerythrin (PE)-labelled antibody and IgG1 isotype control antibody. The percentage CD133+ cells were plotted for all cell lines (A). Differential expression of the CSC marker CD44 was examined using an anti-human CD44 FITC-conjugated antibody and corresponding IgG2b isotype control antibody. Expression levels of CD44 were determined for all cell lines and plotted as a percentage of the tumour cell population expressing CD44 (B). Data are expressed as Mean ± SEM from three independent experiments (n = 3) Data are expressed as Mean ± SEM from three independent experiments (n = 3) (#p<0.01, *p<0.001).

