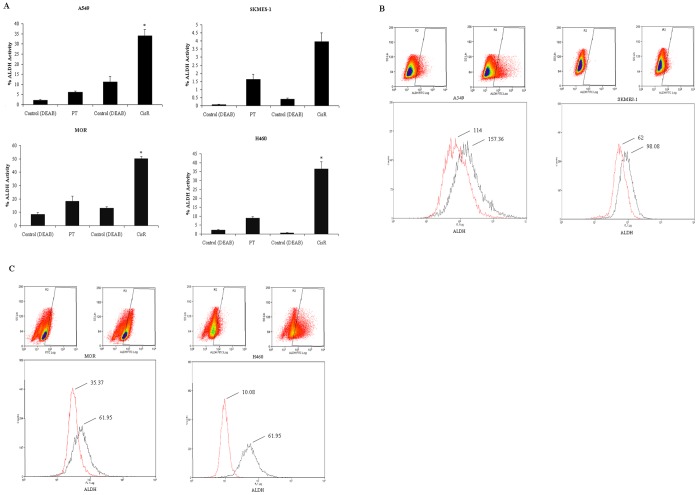
Figure 8. Chemoresistant cell lines display increased aldehyde dehydrogenase (ALDH1) activity.
ALDH1 activity was measured between PT and CisR NSCLC cells using the Aldefluor assay. Cells were incubated with ALDH1 substrate that converts intracellular ALDH1 into a negatively charged reaction product, preventing diffusion from the cells. A control sample was also included for each parent and resistant cell line that consisted of a specific inhibitor of ALDH1, diethylaminobenzaldehyde (DEAB), in order to establish baseline fluorescence. The reaction was measured in the green fluorescence channel of a flow cytometer. The percentage ALDH1 activity between parent and cisplatin resistant cells was calculated (A). Dot plots and histograms showing mean intensity fluorescence (MFI) between parent (red) and cisplatin resistant (black) cell lines are represented (B). Data are expressed as Mean ± SEM from three independent experiments (n = 3) (*p<0.001).

