
Figure 1. MBD1 regulates miR-195 expression in aNSCs.
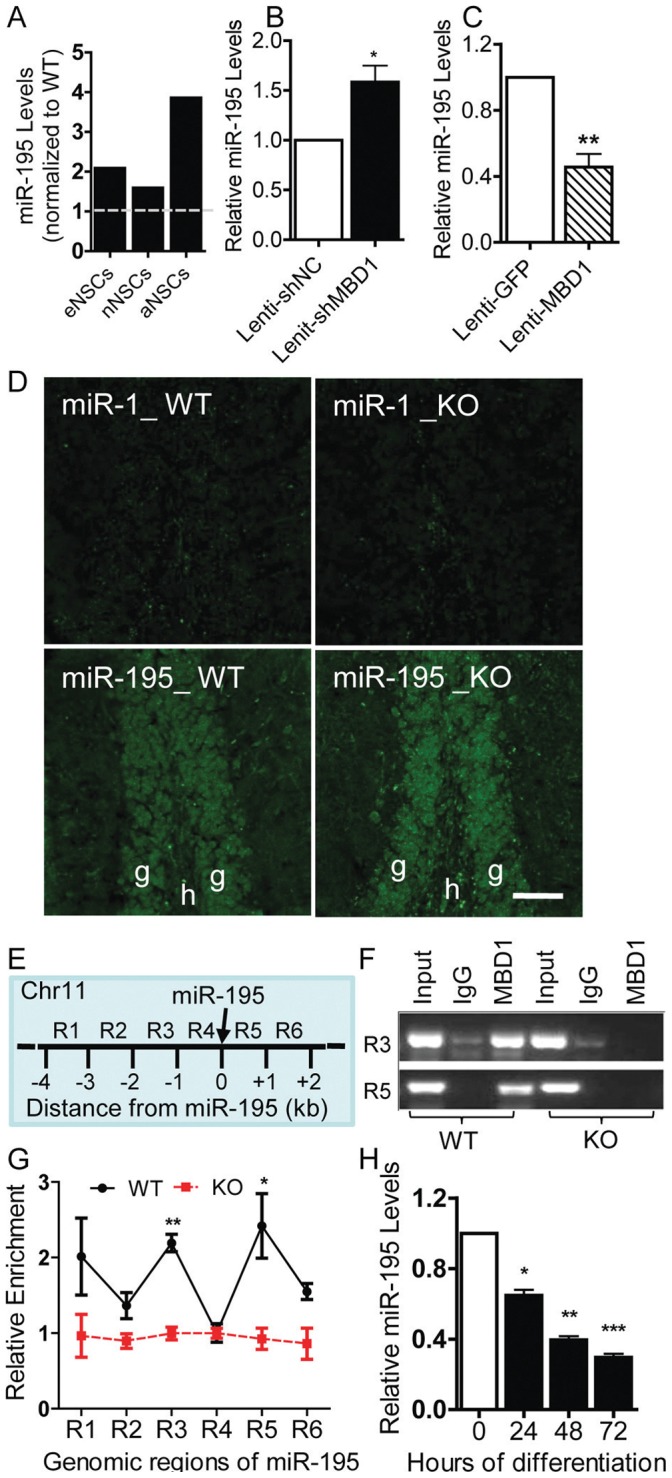
(A): The expression of miR-195 was increased in Mbd1 KO proliferating NSCs derived from embryonic (E14.5) telencephalon cells (eNSCs), neonate (P0) forebrain cells (nNSCs), and adult DG cells (aNSCs). Real-time PCR analyses were performed using independently isolated cells; average values from two experiments were presented for eNSCs and nNSCs, and from one experiment for aNSCs. (B): Acute knockdown of MBD1 resulted in increased miR-195 expression in aNSCs (n = 5, p<0.5). (C) Overexpression of MBD1 in aNSCs led to reduced miR-195 expression (n = 5, p<0.5). (D) Fluorescence in situ hybridization (FISH) analyses showing expression of miR-195 in the dentate gyrus (the bottom two panels) of WT and Mbd1 KO mice (green: miRNA probe signal). (E) Schematic drawing of the 5-kilobase (kb) regions proximal to the miR-195 gene on chromosome 11 that were assayed in ChIP experiments. An increase in staining intensity for miR-195 was seen in Mbd1 KO brains. miR-1 probe was used as a negative control for FISH. Scale bars = 40 µm. g, granule cells of the dentate gyrus. h, hilar region of the dentate gyrus. (F) Chromatin immunoprecipitation (ChIP) assay demonstrating that MBD1 bound to two genomic regions, R3 and R5, corresponding to 2 kb upstream and 1 kb downstream, respectively, of miR-195 genomic, but not in KO brains. (G) ChIP assay followed by real time PCR analysis using 6 sets of primers covering the −4 kb to +2 kb of miR-195 genomic region demonstrates the enrichment of MBD1 protein at genomic sequence 2 kb upstream and 1 kb downstream of the miR-195 locus in WT aNSCs. Quantities were calculated from an input DNA-generated standard curve. Relative enrichment of MBD1 in either WT or KO aNSCs was calculated relative to IgG-only nonspecific control in the same cells (n = 3). Two-way ANOVA, Bonferroni post-test was used for data analyses. For both E and F, IgG-ChIP in WT aNSCs and MBD1-ChIP antibody in Mbd1 KO aNSCs were used as negative controls. (H) The expression levels of miR-195 decreased upon aNSC differentiation. Data are presented as mean ± SEM; *, p<0.05, **, p<0.01, One-sample t-test was used for data analyses.