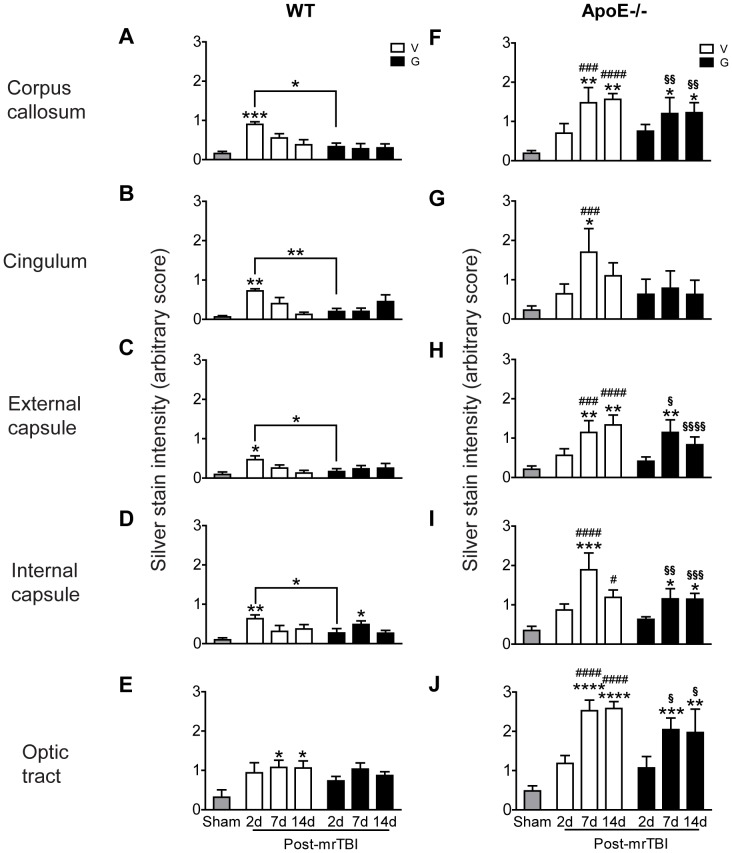
Figure 6. ApoE is required for GW3965 to suppress axonal damage after mrTBI.
Silver-stained images of white matter areas in WT and apoE−/− brains were analyzed semiquantitatively using an arbitrary silver staining scale extending from 0 (<10% argyrophilic structures covering the image field) to 3 (>70% argyrophilic structures covering the image field). The bar graphs represent mean ± SEM silver stain intensity score (arbitrary value) of WT (A–E) and apoE−/− (F–J) brains in the corpus callosum (A, F), cingulum (B, G), external capsule (C, H), internal capsule (D, I), and optic tracts (E, J). Sample sizes were: sham, n = 6/genotype (pooled); untreated mrTBI, n = 5/time point/genotype; GW3965-treated mrTBI, n = 5/time point/genotype. Asterisks above individual bars indicate significant differences compared to the respective sham values (grey bars). *: p<0.05, **: p<0.01, ***: p<0.001, ****: p<0.0001. ### (p<0.001) and #### (p<0.0001) represent significant differences in silver stain scores between untreated WT and apoE−/− mice. § (p<0.05), §§ (p<0.01), §§§ (p<0.001), and §§§§ (p<0.0001) represent significant differences in silver stain scores between GW3965-treated WT and apoE−/− mice. Data were analyzed by two-way ANOVA followed by a Bonferroni post hoc test. Legend: V- untreated mice, open bars, G- GW3965-treated mice, black bars.

