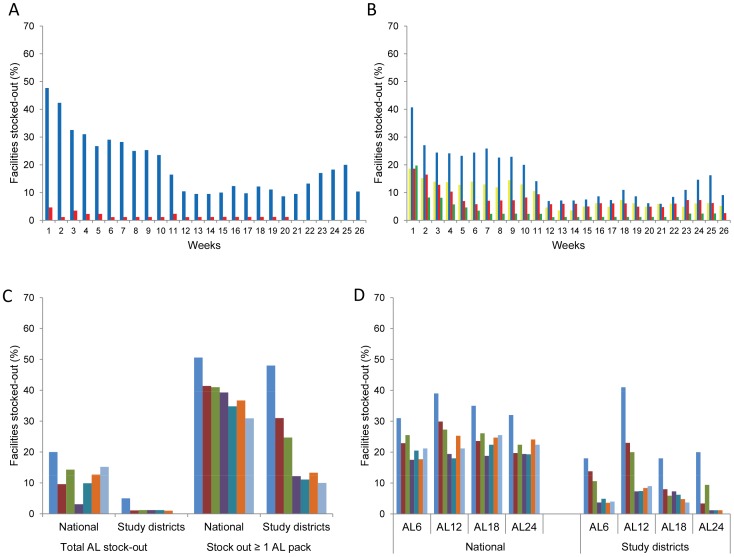
Figure 5. AL stock-out trends in study districts and stock-out comparisons with national trends.
(A) Proportion of health facilities stocked out of all four AL packs and at least one AL pack over 26 weeks. Legend. Blue bars show stock-outs of at least one AL pack; red bars show stock-outs of all four AL packs. (B) Proportion of health facilities stocked out of AL 6, AL 12, AL 18 and AL 24 packs over 26 weeks. Legend. Yellow bars show stock-out of AL 6; blue bars stock-out of AL 12; red bars stock-out of AL 18 and green bars stock-out of AL 24 (C) Stock-out trends of all four AL packs and at least one AL pack in study districts compared to a nationally representative sample. Legend. The 7 consecutive bars show stock-outs in August, September, October, November, December, January and February. (D) Stock-out trends of AL 6, AL 12, AL 18 and AL 24 packs in study districts compared to a nationally representative sample. Legend. The 7 consecutive bars show stock-outs in August, September, October, November, December, January and February.

