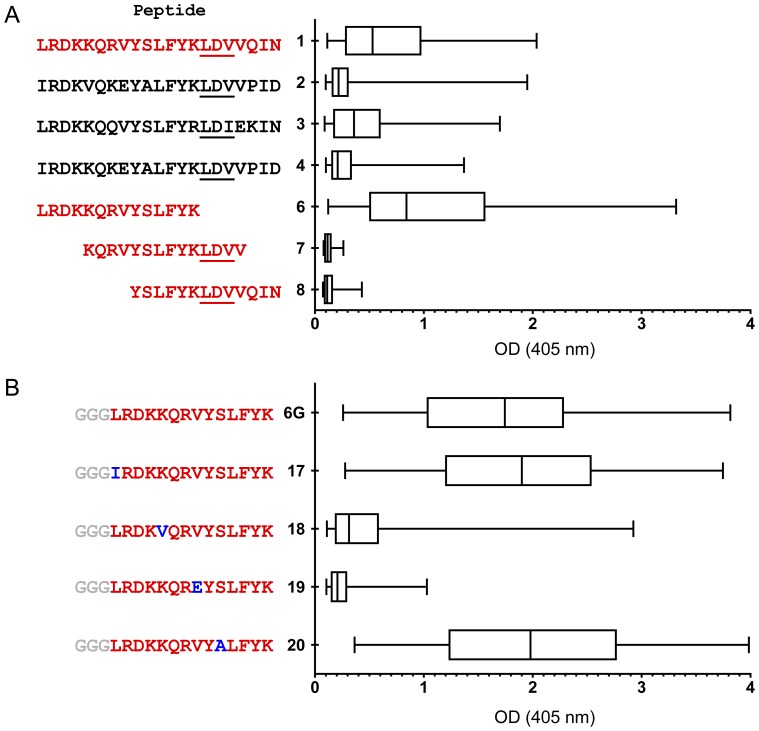
Figure 5. Boxplots showing ELISA reactivity of V2 peptides with plasma (diluted 1∶100) from 80 vaccinees' specimens from the pilot study (Set C).
The distributions of the reactivities are shown where the left edge of each box equals the 25th percentile; the vertical line in each box is the 50th percentile, and the right edge of each box equals the 75th percentile. The boxplots were prepared using Prism, with “whiskers” showing the minimum and maximum responses. Panel A: Four 21-mer N-terminal biotinylated peptides (Peptides 1–4) were selected on the basis of a bioinformatics analysis of V2 sequences from the LANL HIV Database (see text). Panel B: A second peptide panel designed upon inspection of the AAs in Peptides 1–4 in Panel A revealed AAs that distinguish Peptides 1 and 3 from 2 and 4; these appear at positions 165, 169, 172, and 174. To maximally enhance the availability of the epitopes on the peptides used in the fine mapping of the V2 Abs, a spacer of three glycines was inserted between the biotin tag at the N-terminus of the peptide and the V2 sequences.

