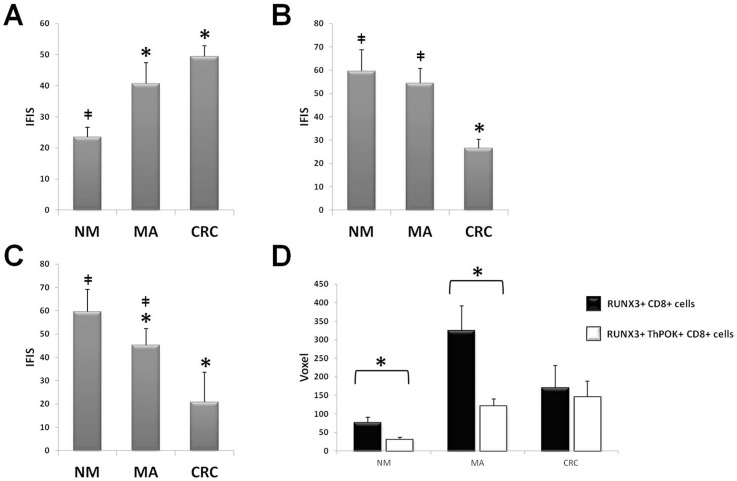
Figure 5. Foxp3, GZMB and RUNX3 fluorescence levels.
Fluorescence levels of Foxp3 (panel A), GZMB (panel B), RUNX3 (panel C) immunostaining. *P<0,05 vs NM; ‡ P<0,05 vs CRC. RUNX3 level in CD8+ T cells coexpressing (white bars) and not coexpressing (black bars) ThPOK in NM, MA and CRC (panel D). *P<0,05.

