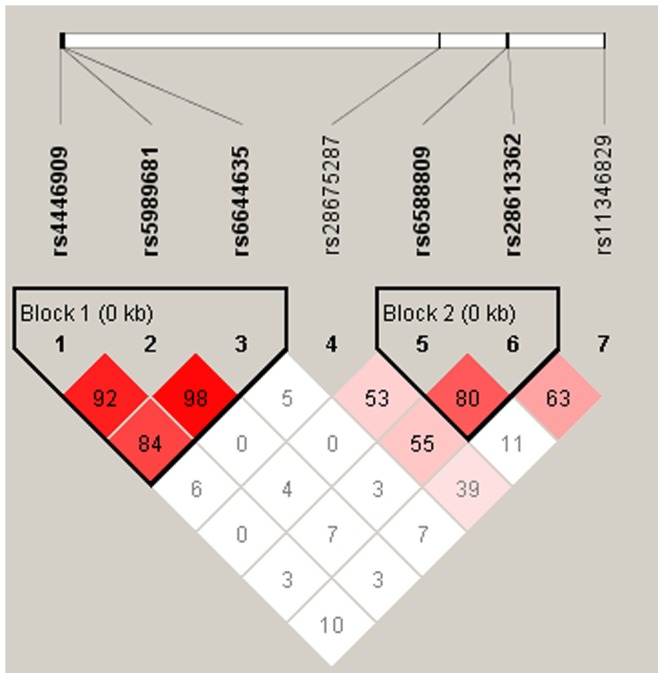
Figure 1. Linkage disequilibrium (LD) block of 4 common SNPs in promoter of ASMT.

Markers with Linkage disequilibrium (LD) (D′<1 and LOD>2) are shown in red through pink (color intensity decreases with decreasing D′ value). D′ value shown within each square represents a pairwise LD relationship between the two polymorphisms. This LD plot was generated with the Haploview.
