
Figure 2. Representative autoradiograms of ligand binding to DA receptors and DA transporter (DAT) in rat brain.
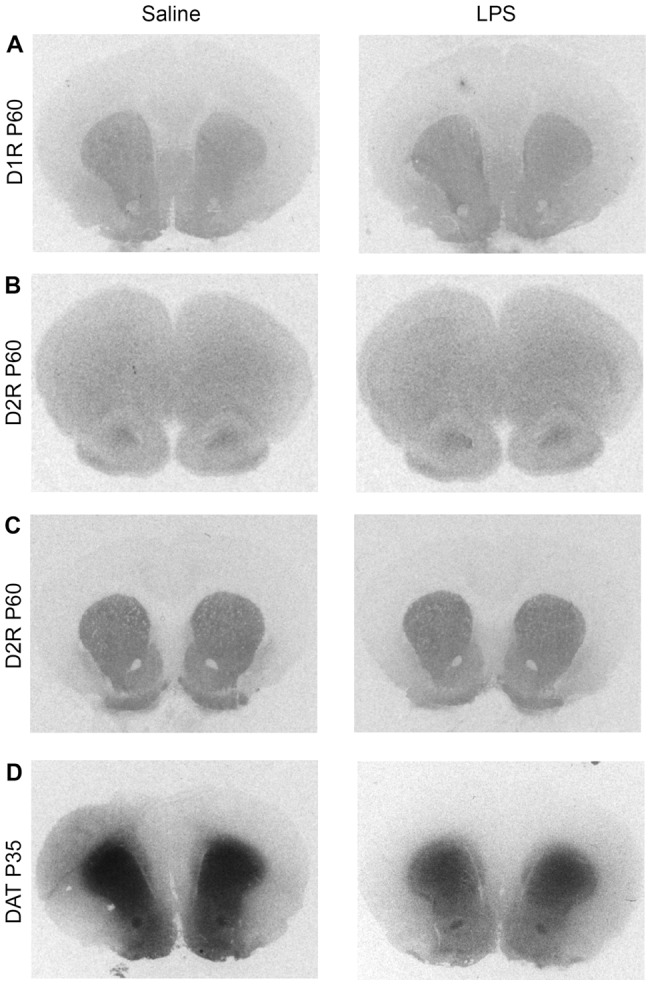
Left and right panels show binding in prenatal saline and LPS treatments respectively. (A), [3H] SCH23390 (D1-like receptor binding) in Str/NAcc; (B), [3H] YM-90151-2 (D2-like receptor binding) in mPFC; (C), [3H] YM-90151-2 in Str/Nacc; and (D), [125I] RTI-121 (DAT binding) in Str/Nacc. D1 and D2 autoradiograms are from animals at P60 whereas DAT binding is shown for P35 rat.