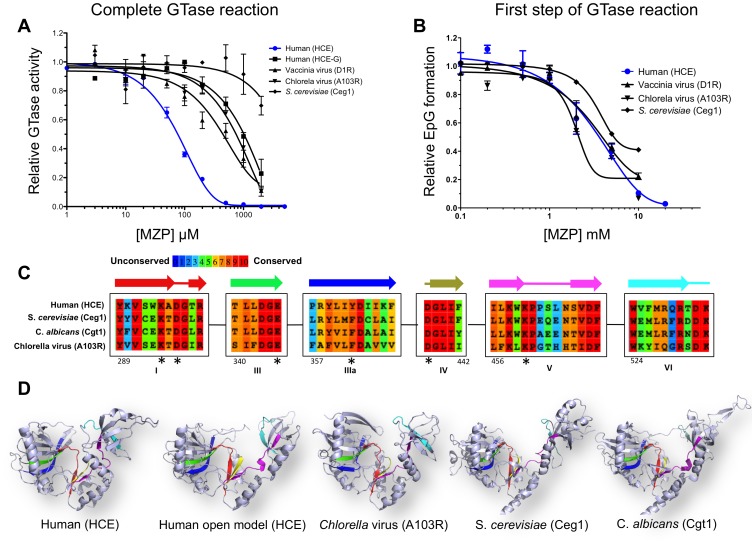
Figure 4. Specificity of MZP inhibition toward RNA guanylyltransferase.
(A) Complete GTase reaction. 5′-diphosphate RNA was capped with HCE, HCE-G229–597, D1R, A103R or Ceg1 GTases in presence of increasing concentration of MZP. (B) Formation of EpG complex. The GTases from human, vaccinia virus, Chlorella virus or S. cerevisiae were allowed to form enzyme-GMP covalent complex in presence of increasing concentration of MZP. (C) Amino acids alignment of the human (HCE), S. cerevisiae (Ceg1), C. albicans and Chlorella virus (A103R) GTases highlighting the sequence conservation. Representation of the six conserved GTase signature motifs (I, III, IIIa, IV, V, VI) and their associated secondary structures (above). Numbering is based on the HCE amino acids. Amino acids predicted to coordinate MZP low affinity binding site are highlighted by an asterisk. (D) GTases harbor a similar three-dimensional architecture. Ribbon diagram of HCE GTase domain in close conformation (PDB: 3S24), in open conformation (homology model base on PDB: 1P16), Chlorella virus GTase (PDB: 1CKN), S. cerevisiae GTase (PDB: 3KYH), C. albicans GTase (PDB: 1P16). Active site color code is representative of the GTase signature motif as displayed in panel C.

