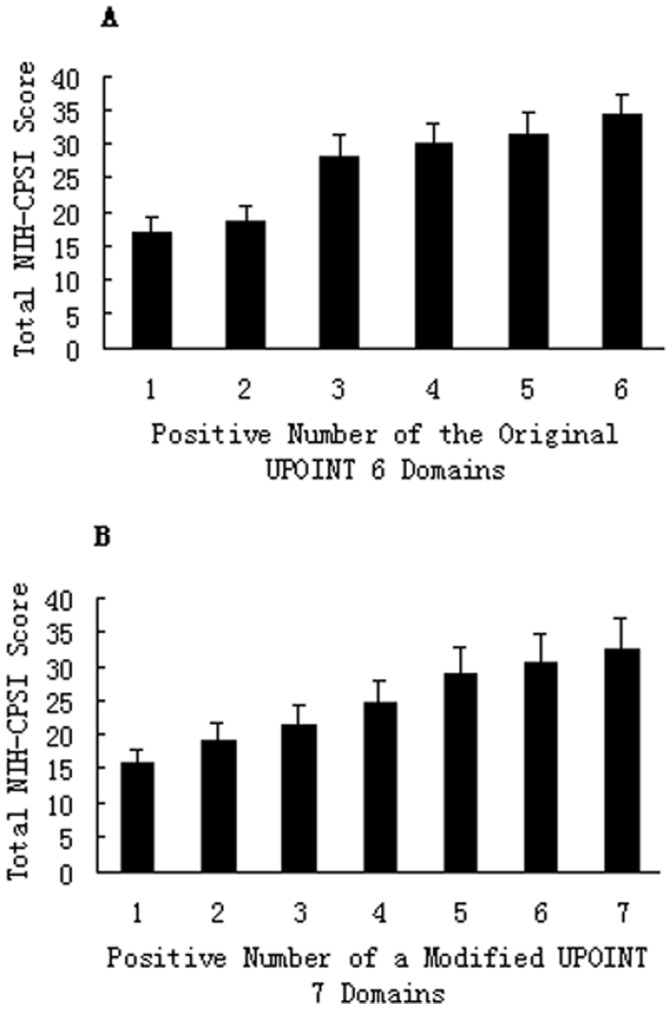
Figure 1. Correlation between NIH-CPSI symptom scores and UPOINT(S) positive number.

Mean total NIH-CPSI symptom scores were compared with the positive number of the original UPOINT 6-domains (A) and a modified UPOINTS 7-domains created by adding an ED domain (B), respectively. Significant difference was seen in the NIH-CPSI total score between groups in A and between groups in B (all P<0.001), respectively. Correlation coefficient r improved from 0.706 (A) to 0.844 (B).
