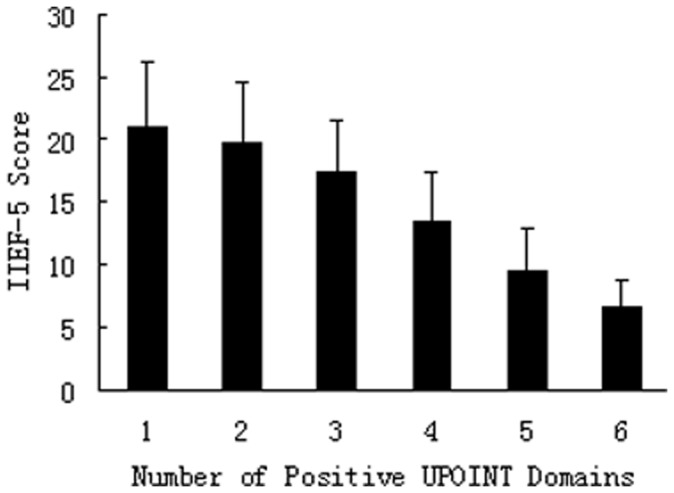
Figure 3. Correlation between IIEF-5 scores and UPOINT positive number.

Mean IIEF-5 scores were compared with the positive number of urinary (U), psychosocial (P), organ specific (O), infection (I), neurological/systemic (N), and tenderness (T) UPOINT domains. Significant difference was seen in the IIEF-5 score between groups (all P<0.001), and the number of positive UPOINT domains was significantly inversely correlated with the IIEF-5 scores (Spearman r = 0.631, P = 0.007).
