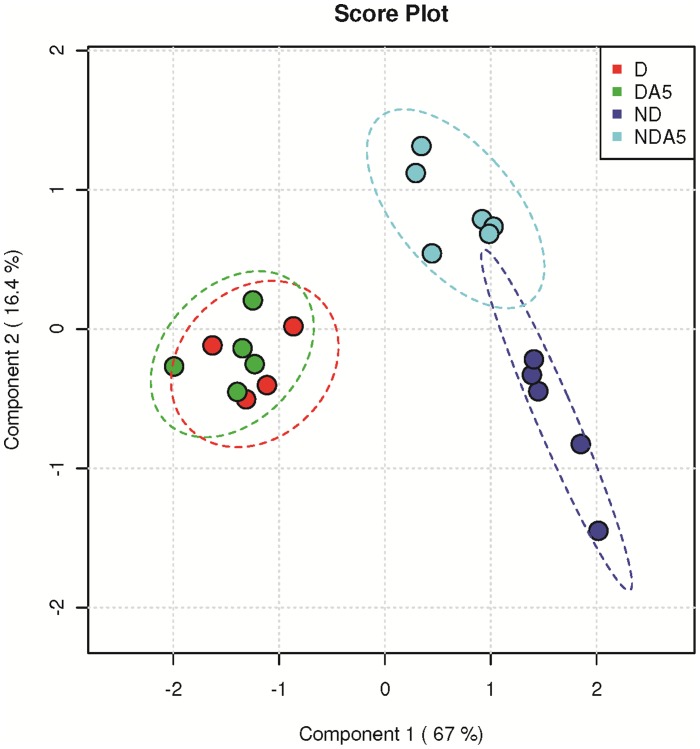
Figure 4. Multivariate analysis (PLS-DA) on metabolomic data.
A: sample projection (4–7 samples) onto the first PLS-DA discriminant plane of non-diapausing (ND) and diapausing (D) Tetranychus urticae females, that were non-acclimated (ND, D) and acclimated at 5°C (NDA5, DA5). B: the variable importance plot shows the metabolites that contributed the most to the first axis (based on VIP scores).

