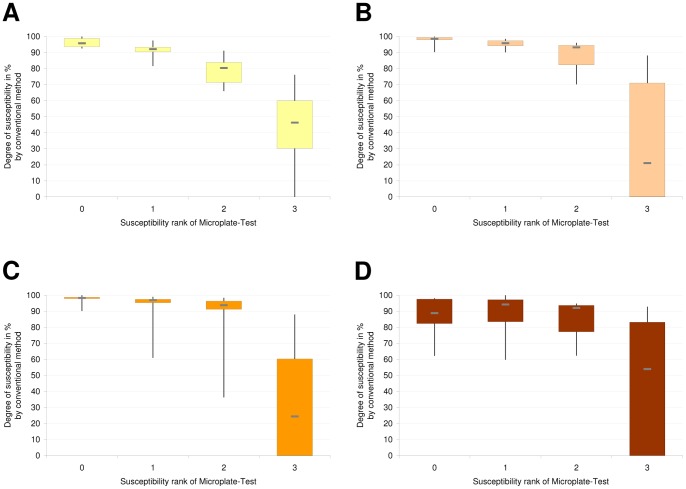
Figure 3. Comparison of the Microplate-Test and the conventional method.
Part A shows the degree of susceptibility for infection by phage 1 of isolates from the four susceptibility ranks. (a,b,c,d: significance, p<0.005). Part B shows the degree of susceptibility for infection by phage 2 of Isolates from the four susceptibility ranks. (a,b,c,d: significance, p<0.02). Part C shows the degree of susceptibility for infection by phage 5 of Isolates from the four susceptibility ranks. (a,b,c: significance, p<0.003). Part D shows the degree of susceptibility for infection by phage 13 of Isolates from the four susceptibility ranks. (a,b: significance, p<0.02).

