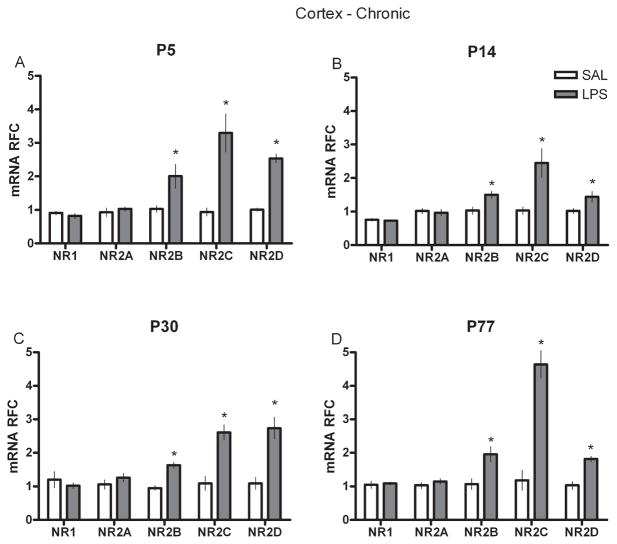
Fig. 4.
Real-time RT-PCR data for chronic cortex (frontal) NR subunit mRNAs (NR1 and NR2A–D) in relative fold change (RFC) from animals treated with either SAL or LPS (100 μg/kg) at (A) P5, (B) P14, (C) P30 or (D) P77. Values are presented as means ± SEM. *Treatment groups that differ significantly (P < 0.05) from their respective control groups.

