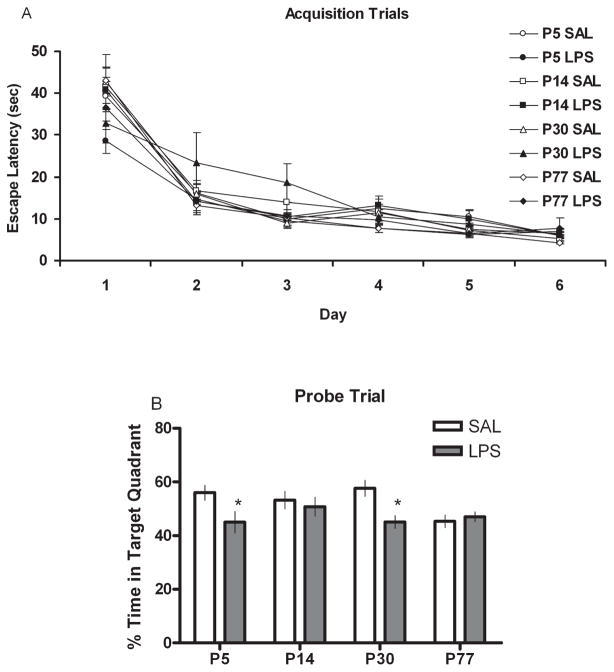
Fig. 5.
Water maze (A) acquisition and (B) probe trial scores presented as escape latency (s) or percent time in the target quadrant, respectively, for animals treated with either SAL or LPS (100 μg/kg) at P5, P14, P30 or P77. Scores are presented as means ± SEM. *Treatment groups that differ significantly (P < 0.05) from their respective control groups.

