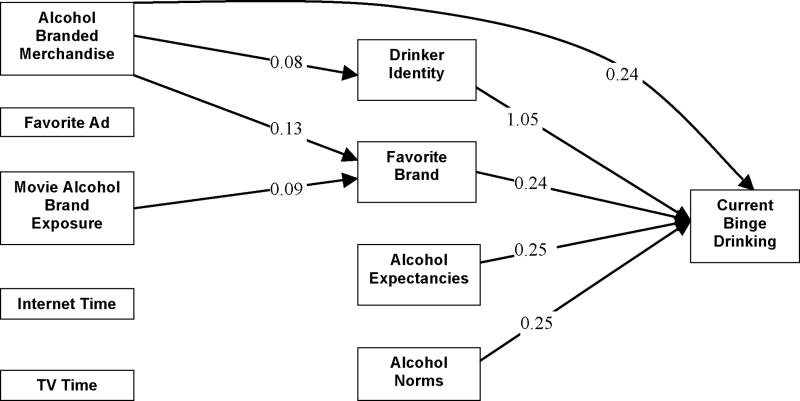
Figure 2.
Mediational Path Model of Alcohol Marketing Receptivity
Numbers are unstandardized path coefficients; all variables scaled so that a one-point increase represents going from lowest to highest risk (5th to 95th percentile for continuous predictors). All illustrated paths drawn are significant; paths not drawn were estimated but not significant in the case of all other marketing to drinking pathways. Pathways for background covariates were also not included in the diagram but can be determined from Table 3

