
FIGURE 1.
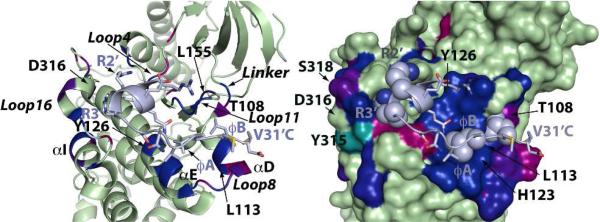
Close-up view of spectral perturbations induced by KIM15-31, plotted using a red (minimum perturbation) to blue (maximum perturbation) gradient (the scale is optimized for maximum visual contrast), on the ribbon (left) and surface (right) representations of an ERK2 mutant bound to KIM16-31m (light blue). Residues with perturbations below the 0.041ppm threshold are colored green. Resonances that disappear upon binding are colored cyan. On the right panel, sidechains belonging to the consensus D-motif sequence: 20R-21R-X5 -27L-X-29L are shown as spheres.