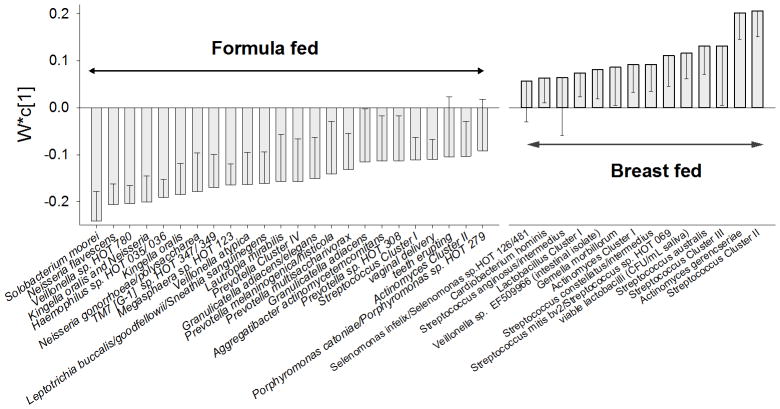
FIGURE 3. Taxa and some infant characteristics that differed between formula and breast-fed infants (Model 2) by PLS-modelling.
The figure illustrates mean loadings with measurement error (95% confidence interval) in a PLS derived column loading plot for exclusively breast- versus formula-fed infants. The underlying PLS model employed all bacterial taxa detected by microarray and potential confounders (see statistics section) simultaneously. Variables with highest loading in each group are displayed, and variables where the confidence interval does not pass 0 (zero) are statistically significant.

