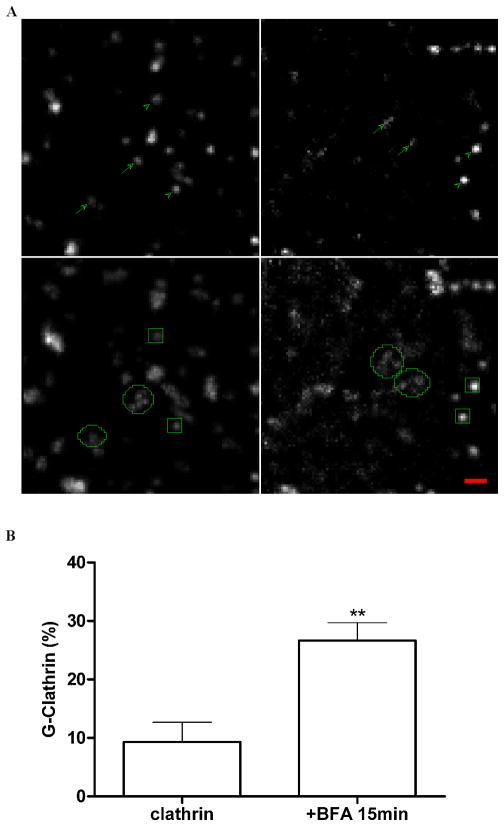
Figure 1. G-Clathrin structures are BFA-resistant.
COS-1 cells expressing GFP-clathrin were imaged before and after treatment with BFA (10 μg/ml, 15 min), and G-clathrin structures in the same field were visualized and quantitated using continuous streams (30 msec exposure, 30 frames total).
A) Imaging of a sample field from a single cell. Upper left panel shows a 50 × 50 pixel region (~5.3 μm square) of a single frame while lower left is the maximum projection of the complete stack. Panels on right show corresponding images of the same region of the same cell after 15 min incubation with BFA. Arrows and circles indicate G-clathrin structures in the upper single frame and lower maximum projection panels, respectively, while arrowheads and squares indicate comparatively stationary clathrin structures (coated pits and endosome associated clathrin) in these panels. Bar, 1 μm.
B) Quantitation of G-clathrin increases upon BFA treatment. Cells were treated as described in Fig. 1A. For quantitation, a 50 pixel square region was randomly selected from the periphery of each of six different cells from 3 independent experiments, comprising ~200 structures in total. Moving objects were tracked and those with average speed ≥ 3 μm/s structures were counted as G-clathrin, and are indicated as a proportion of the total number of clathrin structures in each region. Data are presented as mean ± SEM (n=6) and were analyzed by two-tailed unpaired t-test (**p<0.01).

