
Figure 2. Effects of Arf1 and Arf6 on G-clathrin and G-GGA1 levels.
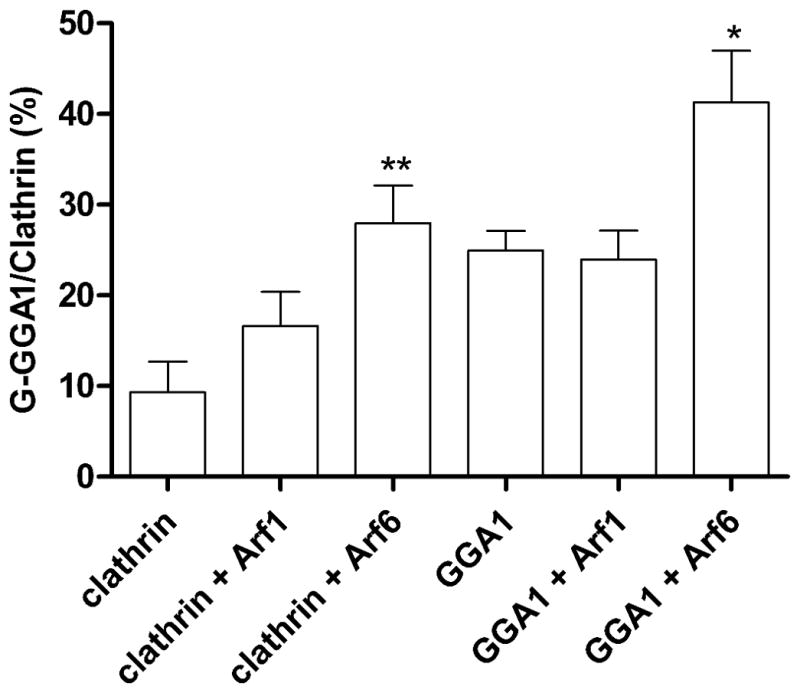
Cells were co-transfected with GFP-clathrin or YFP-GGA1 and with wild-type Arf1 or Arf6 as indicated. G-clathrin structures from 30 frame sequences (30 ms each frame) were analyzed and quantitated as described in Figure 1B. Data represent mean ± SEM (n=6), and were analyzed by one-way ANOVA using Dunnett posttest to compare all columns vs. control. (*p<0.05, **p<0.01).