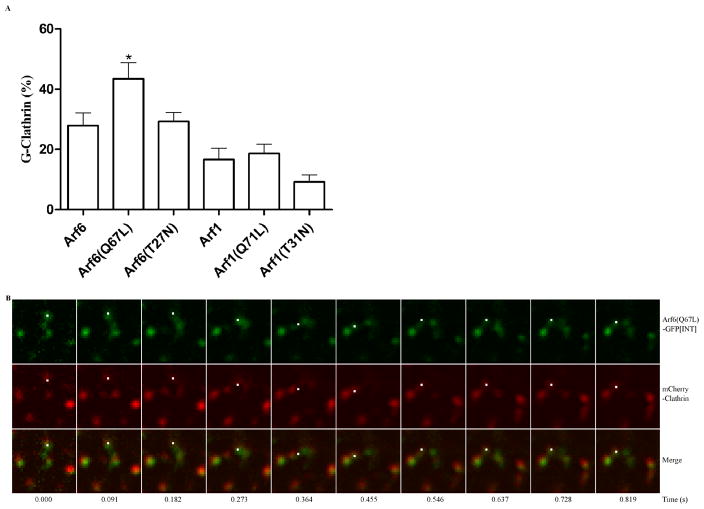
Figure 3. Arf6-GTP drives G-clathrin formation, and is incorporated into the coat structures.
A) Arf6 expression increases G-clathrin, especially for the GTP-bound form of Arf6(Q67L), while Arf1 effects are comparatively minimal. Cells were co-transfected with GFP-clathrin and either wild-type Arf6, ARF6(Q67L) or ARF6(T27N), or the corresponding Arf1 constructs, and image streams (30 images, each of 30 ms duration) were taken. The percentage of G-clathrin spots in the regions were calculated as indicated in Figure 1B. D a t a represented mean ± SEM (n=6) and were analyzed by one-way ANOVA with Dunnett posttest (*p<0.05, **p<0.01).
B) The GTP-bound form of Arf6 can be directly visualized as a stable component in G-clathrin structures. Cells were co-transfected with mCherry-clathrin and Arf6(Q67L)-GFP[INT] and simultaneous two-color image streams were obtained (30 images, each of 30 msec duration, boxes are 3.2 μm square). 87% of mCherry-labeled G-clathrin structures were labeled with Arf6(Q67L)-GFP[INT] (data from 6 cells in 3 independent experiments); in the representative image sequence shown, this is indicated by a white point. Also see Video S3.

