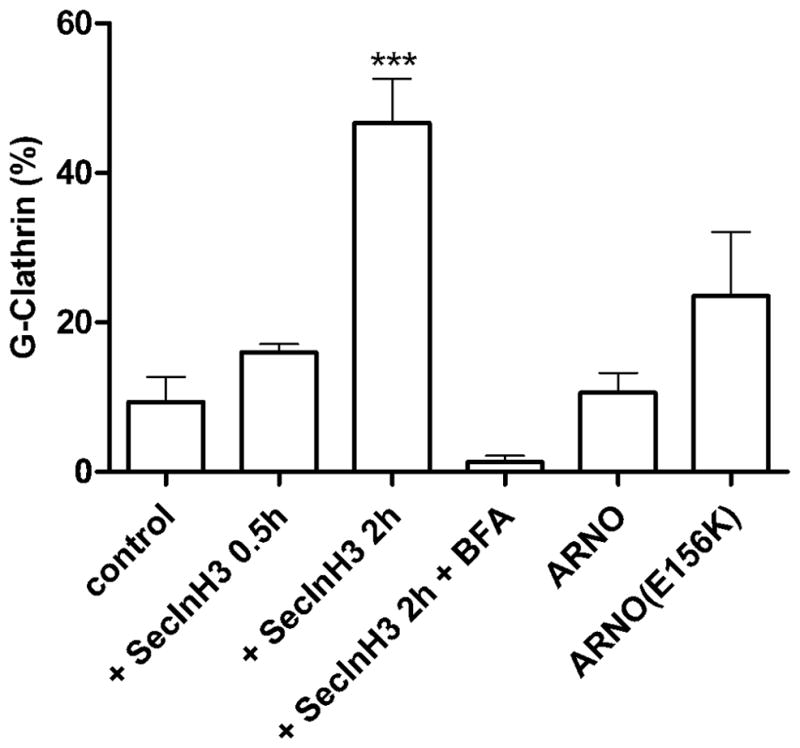
Figure 4. Inhibition of the Arf6-GTP·GDP cycle increases G-clathrin.

Cells were transfected with GFP-clathrin alone or with GFP-clathrin and either wild-type ARNO or dominant-negative ARNO(E156K) as indicated. Cells transfected with only GFP-clathrin were incubated with SecinH3 (6.25 μM) for 0.5 h or 2 h. After the two hour incubation, BFA (10 μg/ml) was added and the incubation continued for 15 min. In all cases, continuous image streams (30 ms each frame, 30 frames) were taken. The percentage of G-clathrin spots in all cells were calculated as indicated in Figure 1B. Data represent mean ± SEM (n=6) and were analyzed by one-way ANOVA with Dunnett posttest (***p<0.001).
