
Fig. 1.
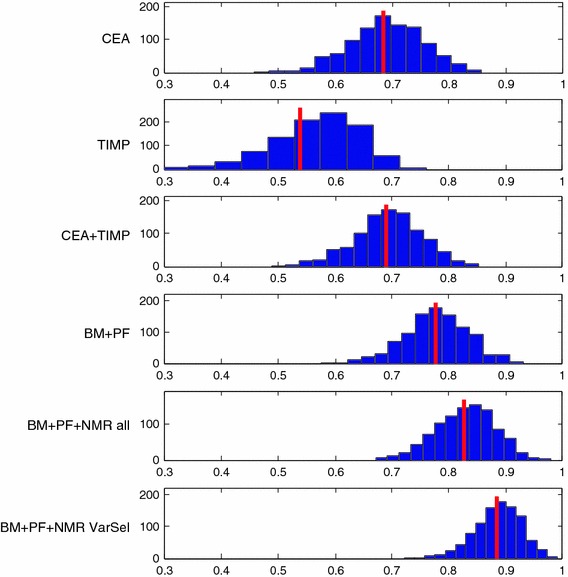
Resulting AUC values from models on various parts of the available data. The vertical red line indicates the average AUC while the histograms indicate the uncertainty of the AUC as determined from bootstrapping. CEA and TIMP are (BM), PF means fluorescence concentration and NMR the total set of 455 NMR variables, whereas NMR VarSel are the ones selected in variable selection (Color figure online)