
Fig. 1.
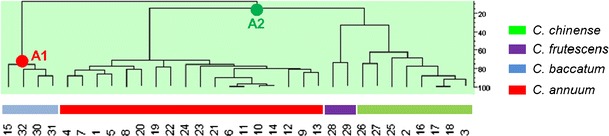
Dendrogram resulting from a hierarchal cluster analysis (HCA) based on the distribution patterns of the AFLP markers. The numbers at the bottom of the figure correspond to the accession numbers shown in the first column of Table 1
Official websites use .gov
A
.gov website belongs to an official
government organization in the United States.
Secure .gov websites use HTTPS
A lock (
) or https:// means you've safely
connected to the .gov website. Share sensitive
information only on official, secure websites.
Dendrogram resulting from a hierarchal cluster analysis (HCA) based on the distribution patterns of the AFLP markers. The numbers at the bottom of the figure correspond to the accession numbers shown in the first column of Table 1