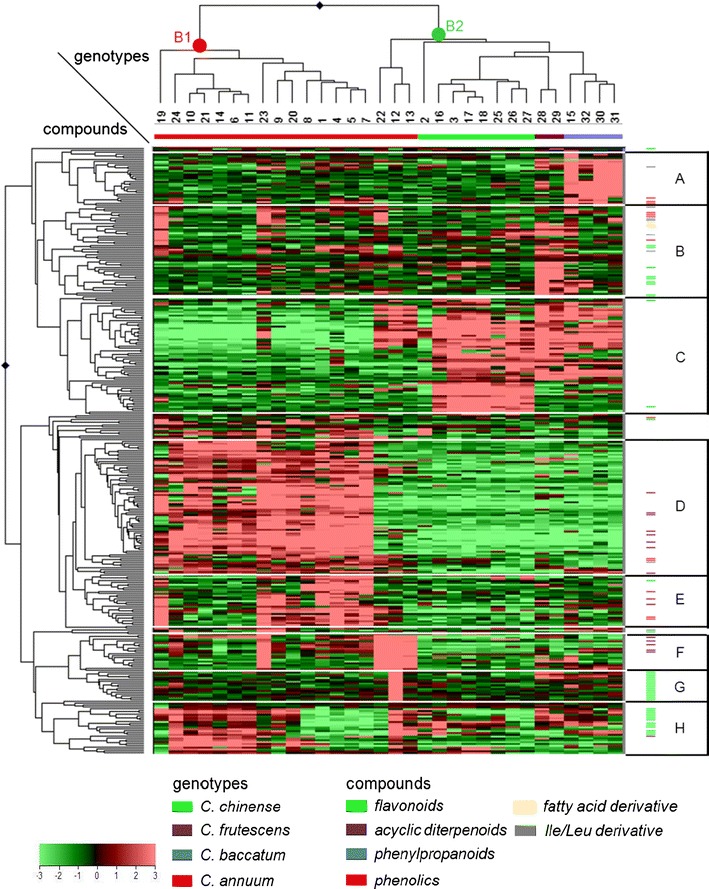
Fig. 3.

Heat map of 331 semi-polar metabolites in 32 pepper accessions. A color-coded matrix represents the mean values of the metabolite intensity in two biological replicates of pepper accessions, which has been log2 transformed and mean-centered. The alphabets (A–H) represent metabolite clusters. Characteristics of the underlying metabolites are presented in the Supplemental Table S1. The numbers below the dendrogram correspond to the accession numbers in the first column of Table 1
