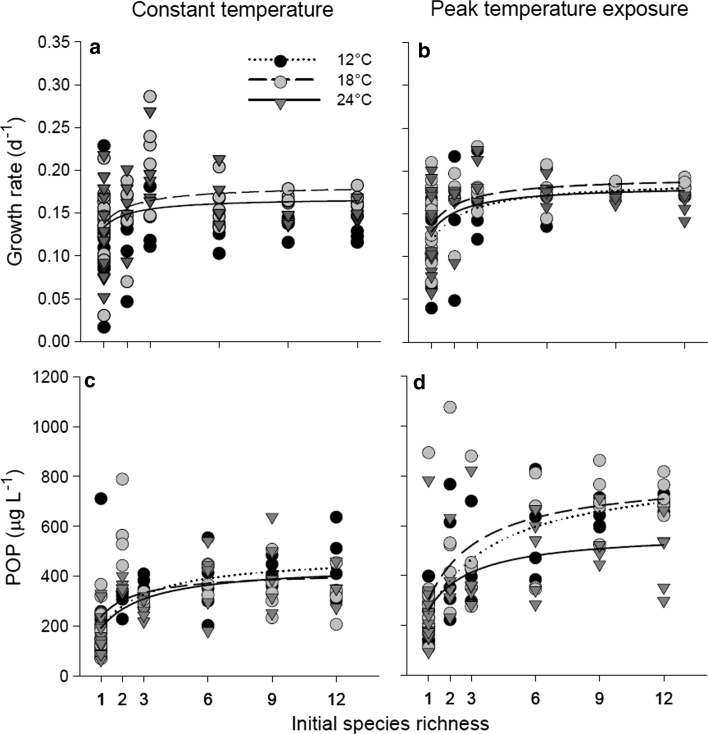
Fig. 1.
a, b Growth rates and c, d particulate organic phosphorus (POP) concentrations in response to initial species richness: a, c after 2 weeks of constant temperatures at 12, 18, or 24 °C (t 1) and b, d after an additional week of short-term temperature peaks of +4 °C (t 2). Significant saturation curves (y = a × x/(b + x) are displayed; n = 40; variables, see Online Resource Table S4)

