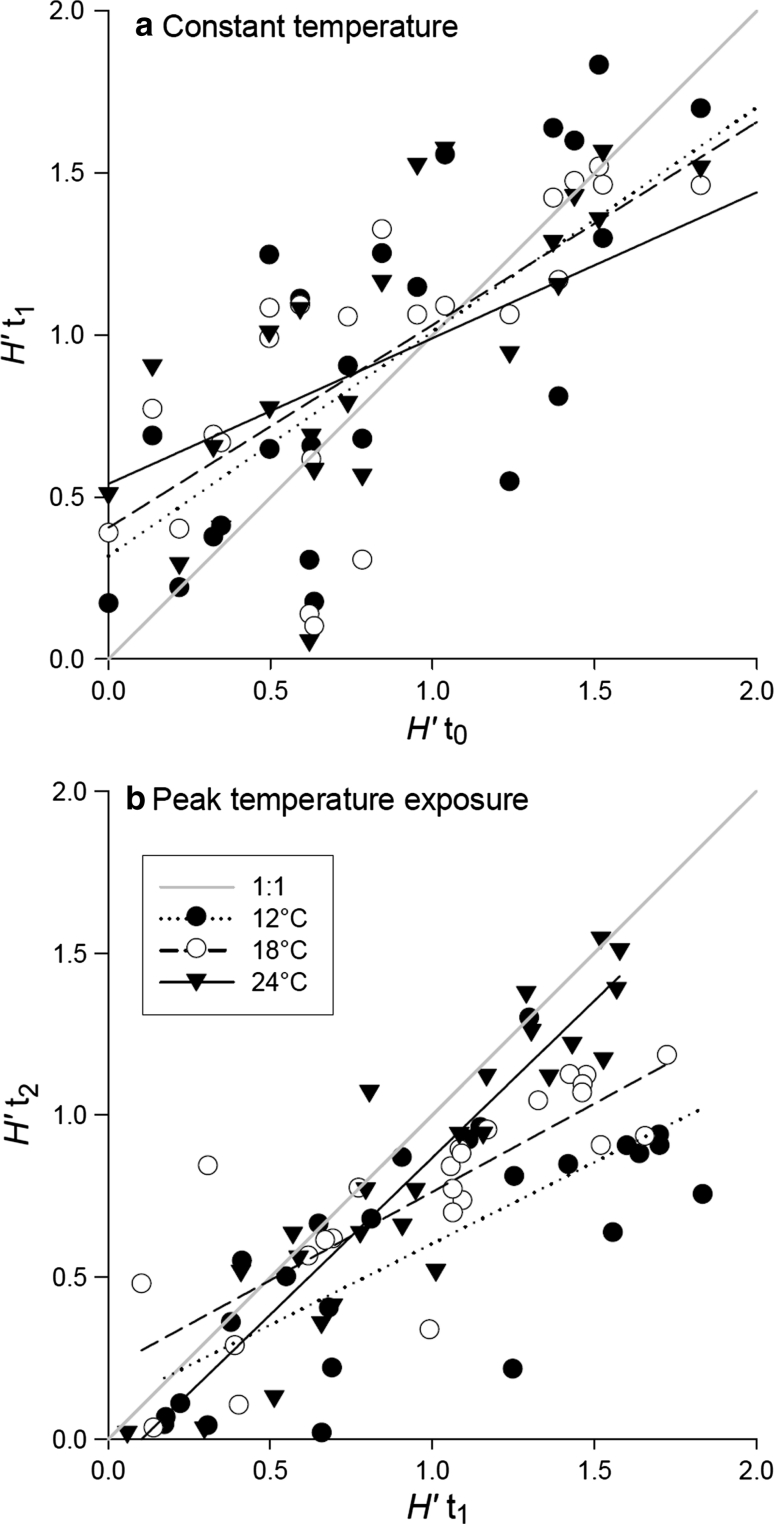
Fig. 5.
a Diversity after 2 weeks of constant temperatures (H′t 1) as a function of initial diversity (H′t 0) for the three experimental temperatures 12 °C (H′t 1 = 0.28 + 0.67 × H′t 0; r 2 = 0.57; P < 0.0001), 18 °C (H′t 1 = 0.41 + 0.57 × H′t0; r 2 = 0.54; P < 0.001), and 24 °C (H′t 1 = 0.52 + 0.44 × H′t0; r 2 = 0.39; P < 0.001) including linear regressions. b Diversity after temperature peaks (H′t 2) as a function of diversity after 2 weeks of constant temperatures (H′t 1) for the three experimental temperatures 12 °C (H′t 2 = 0.1 + 0.5 × H′t1; r 2 = 0.55; P < 0.001), 18 °C (H′t 2 = 0.22 + 0.54 × H′t 1; r 2 = 0.67; P < 0.001), and 24 °C (H′t 2 = −0.1 + 0.97 × H′t 1; r 2 = 0.85; P < 0.001) including linear regressions. Both graphs include 1:1 line

