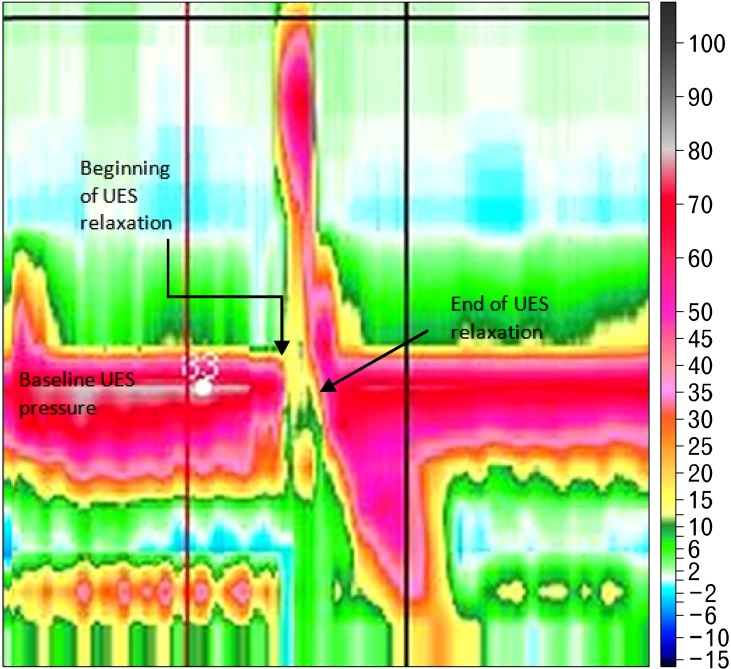
Figure 2.
Spatiotemporal plots of water swallows from 1 subject. Catheter position is on the y-axis (position of upper esophageal sphincter [UES] is at 20 cm from the nares), time is on x-axis (time between vertical grid lines is 1 sec), and pressure is indicated by the color scale on the right of the figure. UES relaxation duration is time difference between start and end of relaxation.

