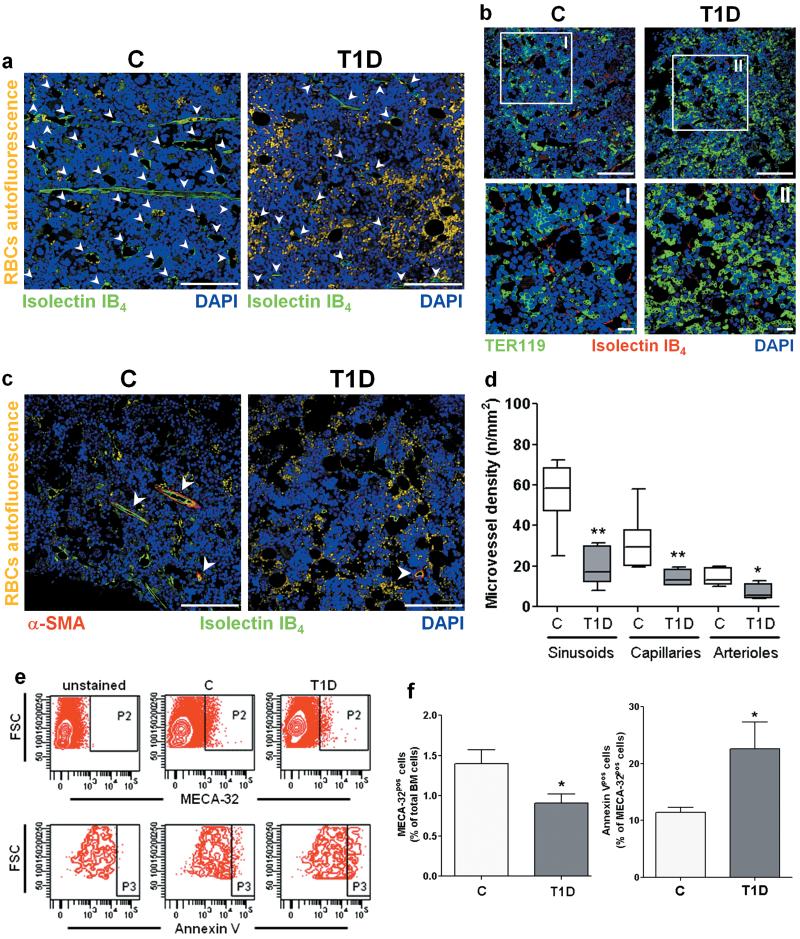
Figure 2. Microangiopathy in BM of T1D mice.
Reduced vascular density and erythrocyte extravasation in T1D BM (a-d). Arrowheads point vascular structures. Scale bars: 100μm and 20μm (I and II). BMEC depletion and increased BMEC apoptosis in diabetes (e,f). n=8 mice per group. *P<0.05,**P<0.01 vs. C.

