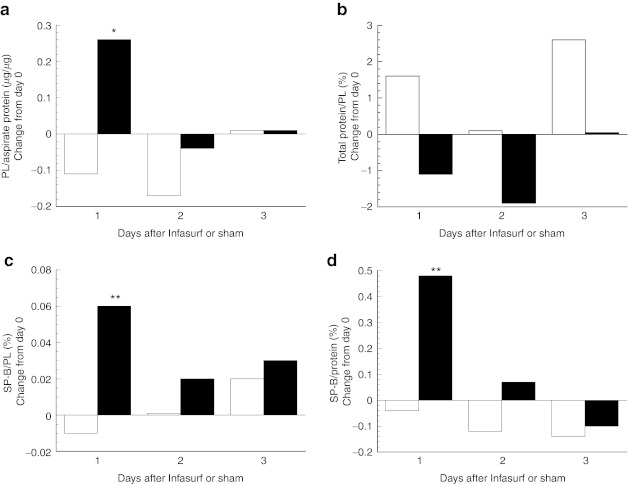
Figure 2.
Absolute change in surfactant parameters following study drug dosing (days 1–3). Data are median values for the Control (white bars, n = 43–47 from 20 infants) and Surfactant (black bars, n = 55–64 from 27 infants) groups. (a) Surfactant recovery, phospholipid (PL) normalized to total protein content of tracheal aspirate; (b) total protein in surfactant pellet as a percentage of PL; (c) surfactant protein-B (SP-B) content of surfactant pellet, normalized to PL; and (d) SP-B content normalized to total protein in surfactant pellet. P values are for comparison of the change between groups, *P = 0.04, **P ≤ 0.002.

