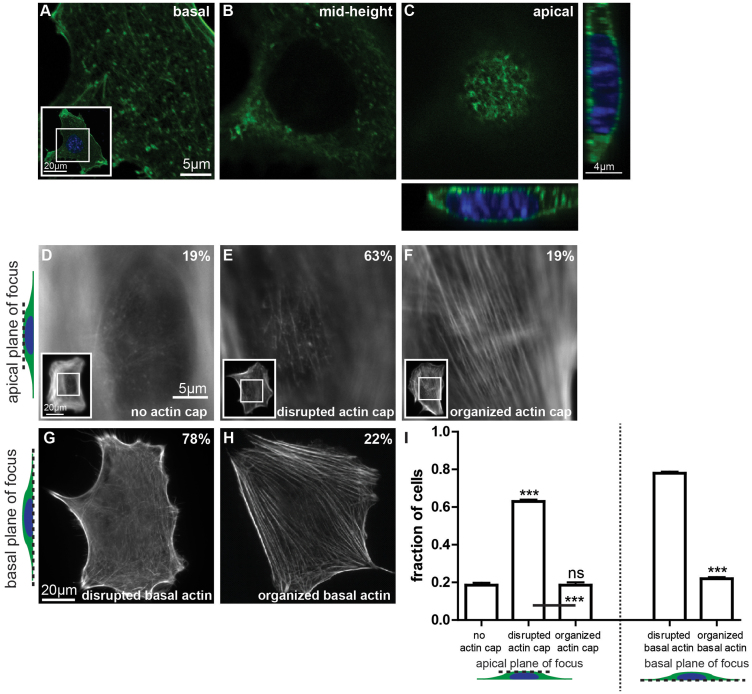
Figure 1. Defining the architecture of the perinuclear actin cap.
(A–C). Confocal fluorescent micrographs of the actin filament network obtained at the basal surface, mid-height, and the apical surface of wildtype MEFs in serum-starved conditions. Inset shows the whole imaged cell at the basal surface, with the inner white box framing the zoomed region shown in the main panels. Thin confocal cross-sections along (far right panel) and perpendicular to (bottom panel) the actin cap direction show a bulging nucleus. Cross-sections were expanded 1.5 fold in the apical direction of the cell to aid visualization. (D–F). Conventional epifluorescence microscopy focusing on the top of the nucleus can readily reveal either the total absence of an organized perinuclear actin cap (D), a disrupted actin cap (E), or a highly organized perinuclear actin cap (F). Insets show the whole imaged cell at the apical surface, with inner white boxes framing the zoomed regions shown in the main panels. (G) and (H). Architecture of basal actin stress fibers, which are either disrupted/rare (G) or organized (H). Numbers shown in the top right corner of the panels correspond to the percentage of cells showing that particular actin organization (see panel I). For all images in this figure, F-actin is visualized with phalloidin. (I). Percentages of cells displaying an organized perinuclear actin cap, a disrupted actin cap, or no actin cap (left graph) or organized or disrupted basal actin (right graph). Significance stars indicate differences between bars and the first bar in the set, unless otherwise noted, using a one-way ANOVA test or a t-test. On the graphs, *** and ns indicate p value <0.001 and >0.05, respectively. α = 0.05 was used for all significance tests. Three independent experiments were conducted to quantify a total of 150 cells.

