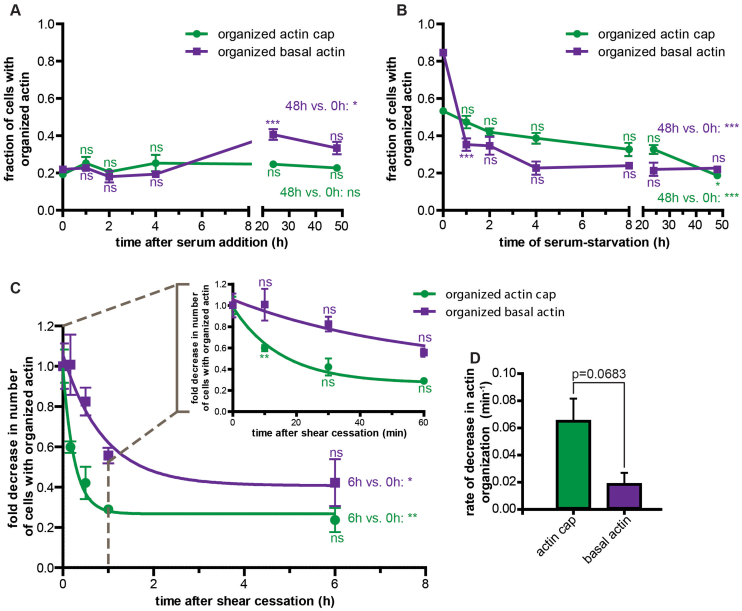
Figure 3. Actin cap dynamics following mechanical stimulation are significantly faster than following biochemical stimulation.
(A) and (B). Percentages of cells showing an organized actin cap (green curves) and organized basal stress fibers (purple curves) after either switching to serum-starved conditions following regular cell culture with serum (B), or serum addition following 2-day serum-starvation (A). (C). Fold decrease in the number of cells with organized actin caps (green curve) and organized basal stress fibers (purple curve) following the cessation of shear. Inset shows early kinetics. (D). Rates of decay in the percentages of cells with organized actin caps (green bar) and organized basal stress fibers (purple bar) upon cessation of shear. For all curves in this figure, significance stars just above or below data points compare the considered time point to the time point just before it using one-way ANOVA tests. Significances on far right of graphs indicate differences between the last time points and the first time points, as indicated. ***, **,*, and ns indicate p value <0.001, <0.01, <0.05, and >0.05, respectively. α = 0.05 was used for all significance tests. Three independent experiments were conducted to quantify a total of 150 cells per condition.

