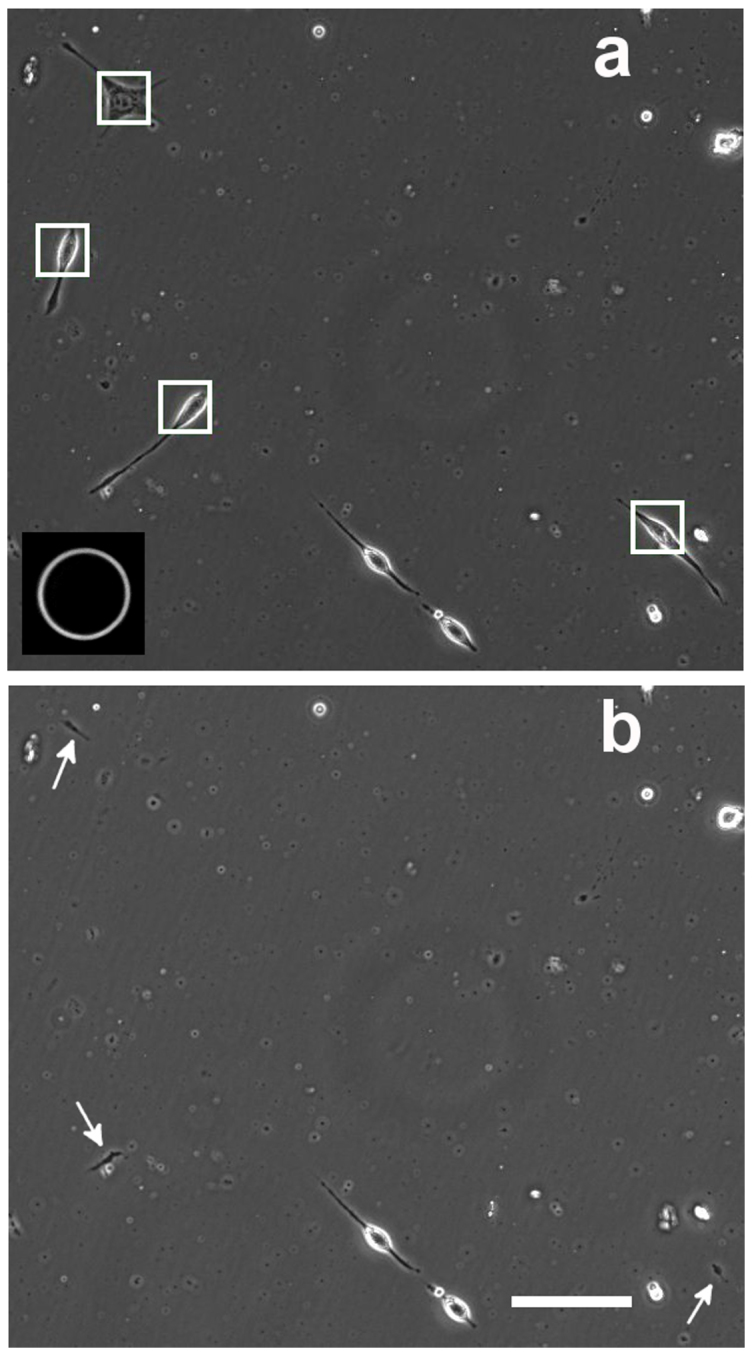
Figure 4. Cell damage.

3T3 cell culture before (a) and after (b) picking up 4 cells indicated by white frames in (a). Note the cell processes remaining on the surface highlighted by the arrows in (b). Only one cell out of four survived this sorting. Aperture of the micropipette in action is shown in the inset of (a). Scale bar: 100 μm.
