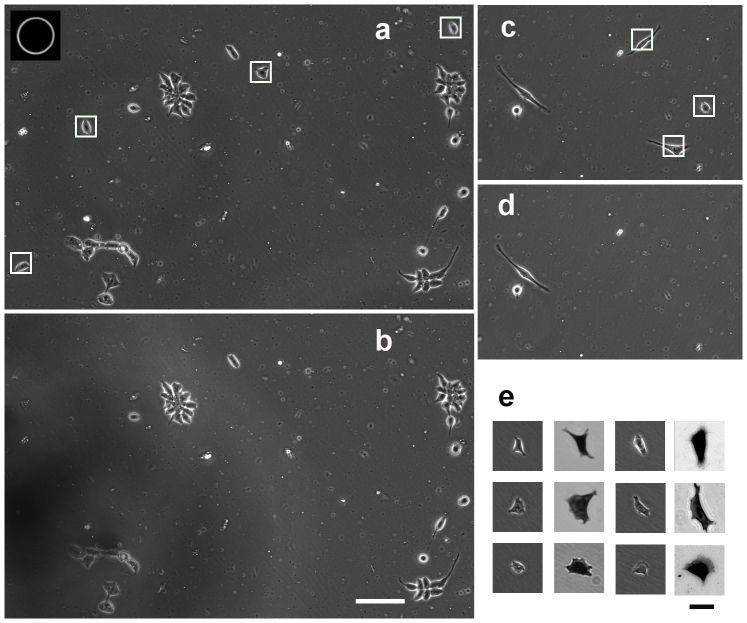
Figure 5. Cell survival.
NE-4C (a, b) and 3T3 (c, d) cell cultures before (a, c) and after (b, d) sorting, i.e., top panels show the cultures before and bottom panels after sorting. Cells selected manually for sorting are indicated by white frames. (e) shows cells surviving 2 h after sorting. First column from the left: phase-contrast image of the 3 out of 4 NE-4C survivors. Second column: same cells stained with methylene blue and captured with 20× objective lens. Third and fourth column show the 3 out of 3 3T3 survivors. Cultures were pretreated with trypsin-EDTA before sorting. Aperture of the micropipette in action is shown in the inset of (a). Scale bar for all phase-contrast images in (b): 100 μm. Scale bar for bright field images in (e): 25 μm.

