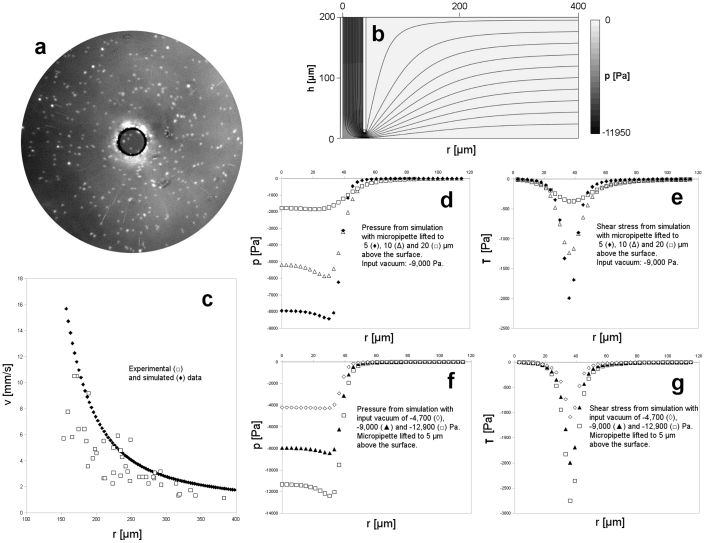
Figure 6. Flow field of the micropipette.
(a) Fluorescent beads at the bottom of the Petri dish moving with the flow generated by the micropipette with an aperture of 69 μm shown in the center. Moving beads 10 μm above the surface appear as narrow radial lines, beads adhered to the surface appear as out-of focus dots as the objective was focused 10 μm above the surface. Beads tend to adhere to the surface out of the micropipette close to its edge. Vacuum: −8,700 Pa, exposition time: 10 ms, bead size: 2 μm. (b) Side view of the simulated velocity and pressure of flow generated by a vertical micropipette in the proximity of a horizontal plane with the same geometry as applied in the experiment and input vacuum of −9,000 Pa. Panel size: 0.4 × 0.2 mm. Velocity and pressure is indicated by streamlines and color code, respectively. The darker color means the lower pressure from 0 to −11,950 Pa. (c) Radial flow velocity as a function of radial distance measured from the center of the micropipette. Experimental ( ) and simulated (
 ) data calculated from the displacement of beads shown in (a) and from the model outlined in (b) at a height of 10 μm above the surface, respectively. (d) Pressure on the surface as a function of radial distance calculated from the simulation with 3 different values: 5 (
 ), 10 (
 ) and 20 (
 ) μm of distance between the surface and the micropipette. Vacuum: −9,000 Pa. (e) Similar plot to (d) for the shear stress on the surface. (f) Pressure on the surface as a function of radial distance calculated from the simulation with 3 different values: −4,700 (
 ),−9,000 (
 ) and −12,900 (
 ) Pa of vacuum. Distance between the micropipette and the surface: 5 μm. (g) Similar plot to (f) for the shear stress on the surface.

