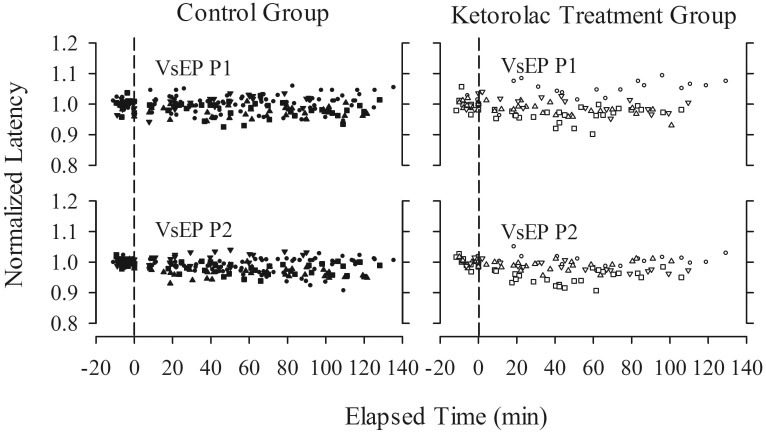
Figure 5.
VsEP normalized response latencies (post drug/mean baseline) as a function of time (in min) for control (control+ sham; n = 11) and ketorolac treatment (n = 6) groups. Data reflect response latency profiles over time and dose and include data from all mice. Cumulative maximal doses of ketorolac ranged from approximately 33 to more than 146 mg/kg. Time 0 is the time of the initial dose of ketorolac. Data to the left of the vertical dashed line represent baseline recordings before drug administration.

