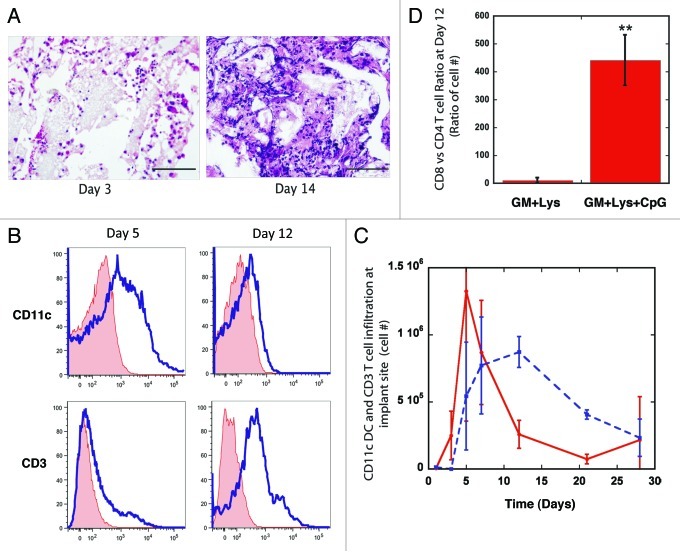
Figure 2.
Kinetics of DC and T cell infiltration into PLG vaccine site. (A) Hematoxylin and Eosin staining of sectioned PLG vaccines explanted from subcutaneous pockets in the backs of C57BL/6J mice after 3 and 14 d. (B) FACS histograms of CD11c(+) DCs and CD3(+) T cells infiltrating PLG matrices loaded with 3000ng GM-CSF, 100μg CpG-ODN and tumor antigens at days 5 and 12. Histograms of isotype control (tinted line) are also included. (C) The total number of CD11c(+) DCs and CD3(+) T cells isolated from PLG vaccines as a function of time post implantation. (D) The ratio of CD8 Tcells vs. CD4 Tcells residing within PLG vaccines at day 12 post-implantation. Values in B and C represent mean and standard deviation (n = 4 or 5). ** p < 0.01 as compared with controls.

